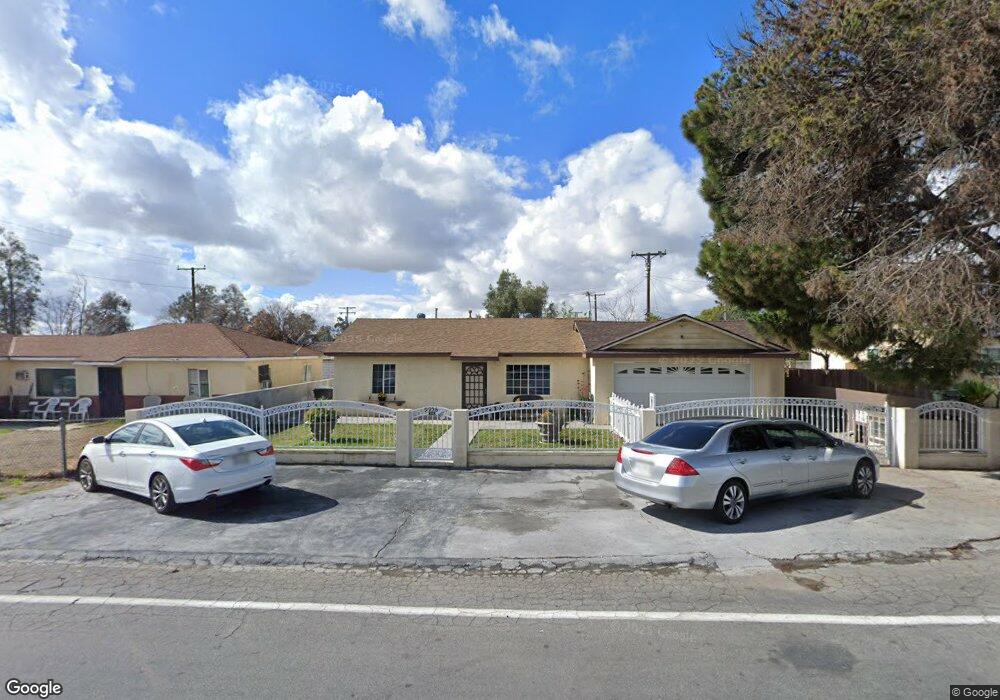
9956 Hemlock Ave Fontana, CA 92335
Estimated Value: $497,000 - $681,000
3
Beds
2
Baths
1,617
Sq Ft
$366/Sq Ft
Est. Value
About This Home
This home is located at 9956 Hemlock Ave, Fontana, CA 92335 and is currently estimated at $592,458, approximately $366 per square foot. 9956 Hemlock Ave is a home located in San Bernardino County with nearby schools including Poplar Elementary School, Sequoia Middle School, and Henry J. Kaiser High School.
Ownership History
Date
Name
Owned For
Owner Type
Purchase Details
Closed on
Feb 27, 2026
Sold by
Torres and Torres Sandra
Bought by
Torres Sandra
Current Estimated Value
Purchase Details
Closed on
Jun 29, 2005
Sold by
Torres Alejandro and Munoz Sandra E
Bought by
Torres Alejandro and Torres Sandra
Purchase Details
Closed on
Jan 15, 2003
Sold by
Munoz Sandra E
Bought by
Torres Alejandro and Munoz Sandra E
Home Financials for this Owner
Home Financials are based on the most recent Mortgage that was taken out on this home.
Original Mortgage
$104,000
Interest Rate
5.96%
Purchase Details
Closed on
Dec 15, 2000
Sold by
Paris Patrick S and Paris Beverly A
Bought by
Munoz Sandra E
Home Financials for this Owner
Home Financials are based on the most recent Mortgage that was taken out on this home.
Original Mortgage
$85,481
Interest Rate
7.81%
Mortgage Type
FHA
Purchase Details
Closed on
Sep 11, 2000
Sold by
Hage Kathleen A
Bought by
Trustees Financial Corp
Create a Home Valuation Report for This Property
The Home Valuation Report is an in-depth analysis detailing your home's value as well as a comparison with similar homes in the area
Purchase History
We collect this data history from publicly available records. To have your information removed, we recommend requesting removal directly through your county’s website.
| Date | Buyer | Sale Price | Title Company |
|---|---|---|---|
| Torres Sandra | -- | None Listed On Document | |
| Torres Alejandro | -- | -- | |
| Torres Alejandro | -- | Southland Title | |
| Munoz Sandra E | $86,500 | First American Title Ins Co | |
| Trustees Financial Corp | $42,293 | -- |
Source: Public Records
Mortgage History
We collect this data history from publicly available records. To have your information removed, we recommend requesting removal directly through your county’s website.
| Date | Status | Borrower | Loan Amount |
|---|---|---|---|
| Previous Owner | Torres Alejandro | $104,000 | |
| Previous Owner | Munoz Sandra E | $85,481 | |
| Closed | Munoz Sandra E | $2,586 |
Source: Public Records
Tax History
| Year | Tax Paid | Tax Assessment Tax Assessment Total Assessment is a certain percentage of the fair market value that is determined by local assessors to be the total taxable value of land and additions on the property. | Land | Improvement |
|---|---|---|---|---|
| 2025 | $2,178 | $201,067 | $40,682 | $160,385 |
| 2024 | $2,026 | $197,124 | $39,884 | $157,240 |
| 2023 | $1,972 | $193,259 | $39,102 | $154,157 |
| 2022 | $1,963 | $189,469 | $38,335 | $151,134 |
| 2021 | $1,937 | $185,754 | $37,583 | $148,171 |
| 2020 | $1,931 | $183,850 | $37,198 | $146,652 |
| 2019 | $1,872 | $180,245 | $36,469 | $143,776 |
| 2018 | $1,899 | $176,711 | $35,754 | $140,957 |
| 2017 | $1,886 | $173,246 | $35,053 | $138,193 |
| 2016 | $1,853 | $169,849 | $34,366 | $135,483 |
| 2015 | $1,829 | $167,298 | $33,850 | $133,448 |
| 2014 | $1,823 | $164,021 | $33,187 | $130,834 |
Source: Public Records
Map
Nearby Homes
- 15411 Rosemary Dr
- 9995 Redwood Ave
- 14995 Manzanita Dr
- 9905 Elm Ave
- 10409 Hemlock Ave
- 14616 Hunter St
- 0 Fremontia Ave
- 9765 Sycamore Ave
- 0 Boyle Ave
- 2 Hawthorne Ave
- 9408 Poplar Ave
- 15412 Pine Ave
- 15798 Slover Ave
- 15820 Rainbow Dr
- 9078 Hemlock Ave
- 9096 Elm Ave
- 9970 Citrus Ave
- 14958 Granada Ave
- 9055 Elm Ave
- 9289 Sycamore Ln
- 9944 Hemlock Ave
- 9960 Hemlock Ave
- 15075 Rosemary Dr
- 9962 Hemlock Ave
- 15089 Rosemary Dr
- 15067 Rosemary Dr
- 9953 Hemlock Ave
- 9963 Hemlock Ave
- 15057 Rosemary Dr
- 9947 Hemlock Ave
- 9971 Hemlock Ave
- 9996 Hemlock Ave
- 15049 Rosemary Dr
- 9910 Hemlock Ave
- 15080 Rosemary Dr
- 15070 Rosemary Dr
- 9995 Hemlock Ave
- 15039 Rosemary Dr
- 9985 Hemlock Ave
- 15062 Rosemary Dr
Your Personal Tour Guide
Ask me questions while you tour the home.