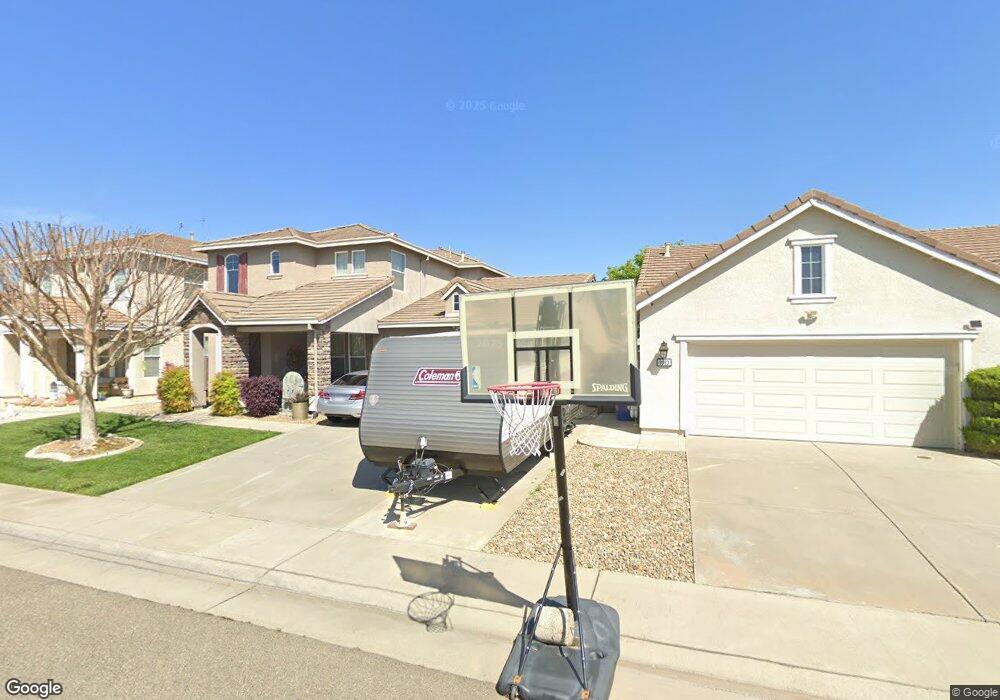
9959 Jacinth Place Sacramento, CA 95829
Estimated Value: $257,000 - $700,000
4
Beds
3
Baths
2,229
Sq Ft
$254/Sq Ft
Est. Value
About This Home
This home is located at 9959 Jacinth Place, Sacramento, CA 95829 and is currently estimated at $566,355, approximately $254 per square foot. 9959 Jacinth Place is a home located in Sacramento County with nearby schools including Robert J. Fite Elementary School, T. R. Smedberg Middle School, and Sheldon High School.
Ownership History
Date
Name
Owned For
Owner Type
Purchase Details
Closed on
Oct 19, 2010
Sold by
Federal National Mortgage Association
Bought by
Johnson Micka
Current Estimated Value
Home Financials for this Owner
Home Financials are based on the most recent Mortgage that was taken out on this home.
Original Mortgage
$236,811
Outstanding Balance
$155,952
Interest Rate
4.31%
Mortgage Type
FHA
Estimated Equity
$410,403
Purchase Details
Closed on
Jul 2, 2010
Sold by
Fitzpatrick Brad M
Bought by
Federal National Mortgage Association
Purchase Details
Closed on
Feb 19, 2004
Sold by
Beazer Homes Holdings Corp
Bought by
Fitzpatrick Brad M
Home Financials for this Owner
Home Financials are based on the most recent Mortgage that was taken out on this home.
Original Mortgage
$291,206
Interest Rate
4.87%
Mortgage Type
Purchase Money Mortgage
Create a Home Valuation Report for This Property
The Home Valuation Report is an in-depth analysis detailing your home's value as well as a comparison with similar homes in the area
Home Values in the Area
Average Home Value in this Area
Purchase History
| Date | Buyer | Sale Price | Title Company |
|---|---|---|---|
| Johnson Micka | $240,000 | Servicelink | |
| Federal National Mortgage Association | $378,367 | None Available | |
| Fitzpatrick Brad M | $364,500 | Chicago Title Co |
Source: Public Records
Mortgage History
| Date | Status | Borrower | Loan Amount |
|---|---|---|---|
| Open | Johnson Micka | $236,811 | |
| Previous Owner | Fitzpatrick Brad M | $291,206 | |
| Closed | Fitzpatrick Brad M | $54,601 |
Source: Public Records
Tax History Compared to Growth
Tax History
| Year | Tax Paid | Tax Assessment Tax Assessment Total Assessment is a certain percentage of the fair market value that is determined by local assessors to be the total taxable value of land and additions on the property. | Land | Improvement |
|---|---|---|---|---|
| 2025 | $3,541 | $307,466 | $97,360 | $210,106 |
| 2024 | $3,541 | $301,438 | $95,451 | $205,987 |
| 2023 | $3,457 | $295,529 | $93,580 | $201,949 |
| 2022 | $3,402 | $289,736 | $91,746 | $197,990 |
| 2021 | $3,366 | $284,056 | $89,948 | $194,108 |
| 2020 | $3,324 | $281,144 | $89,026 | $192,118 |
| 2019 | $4,611 | $275,632 | $87,281 | $188,351 |
| 2018 | $5,313 | $270,228 | $85,570 | $184,658 |
| 2017 | $5,251 | $264,931 | $83,893 | $181,038 |
| 2016 | $5,058 | $259,738 | $82,249 | $177,489 |
| 2015 | $4,722 | $255,837 | $81,014 | $174,823 |
| 2014 | $2,891 | $250,827 | $79,428 | $171,399 |
Source: Public Records
Map
Nearby Homes
- 8312 Cabochon Way
- 10042 Silver Meadow Way
- 10077 Cristo Dr
- 9980 Crystal Creek Dr
- 10174 Atlantis Dr
- 8595 Mackey Rd
- 9633 Respect Dr
- 9733 Everbloom Way
- 9864 Wildhawk Dr W
- 8696 Cherrington Ln
- 8688 Cherrington Ln
- 8580 Bradshaw Rd
- 10050 Cameron Pines Way
- 8210 Scrimshaw Way
- 9492 Del Seis Dr
- 8294 Courage Dr
- 8298 Courage Dr
- 9929 Phoenician Way
- 7843 Yellow Cups Way
- 7855 Yellow Cups Way
- 9955 Jacinth Place
- 9963 Jacinth Place
- 9958 Amulet Place
- 9967 Jacinth Place
- 9951 Jacinth Place
- 9962 Amulet Place
- 9954 Amulet Place
- 9958 Jacinth Place
- 9966 Amulet Place
- 9950 Amulet Place
- 9954 Jacinth Place
- 9962 Jacinth Place
- 9971 Jacinth Place
- 9966 Jacinth Place
- 9950 Jacinth Place
- 9970 Amulet Place
- 9970 Jacinth Place
- 9975 Jacinth Place
- 8344 Cabochon Way
- 9959 Amulet Place