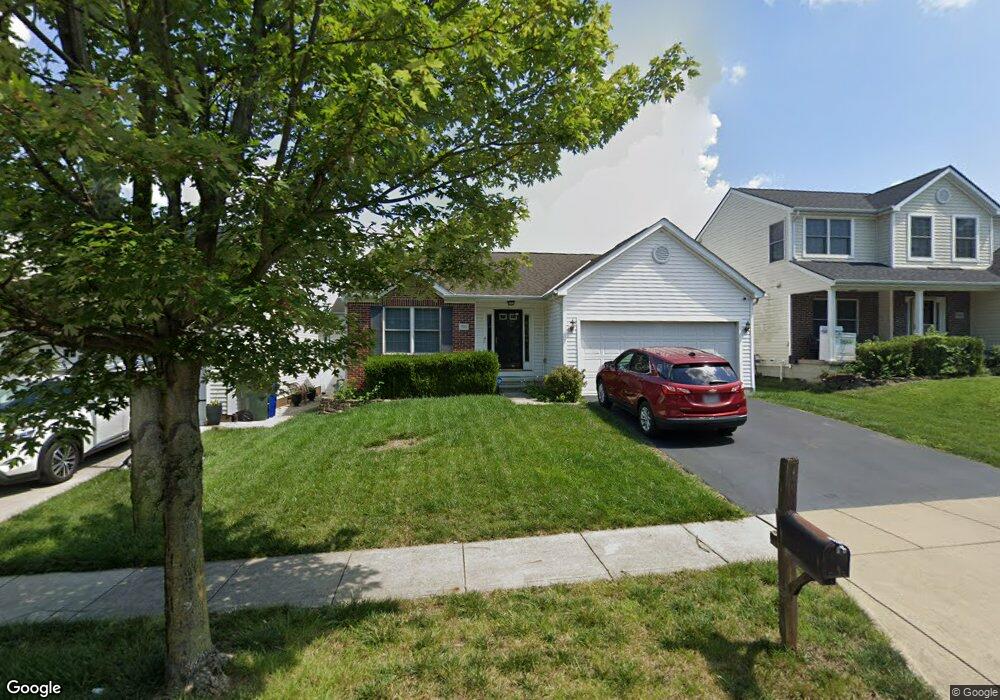
996 Rowland Ave Unit 29 Columbus, OH 43228
Georgian Heights NeighborhoodEstimated Value: $296,000 - $336,000
3
Beds
3
Baths
1,251
Sq Ft
$247/Sq Ft
Est. Value
About This Home
This home is located at 996 Rowland Ave Unit 29, Columbus, OH 43228 and is currently estimated at $308,516, approximately $246 per square foot. 996 Rowland Ave Unit 29 is a home located in Franklin County with nearby schools including Prairie Norton Elementary School, Pleasant View Middle School, and Central Crossing High School.
Ownership History
Date
Name
Owned For
Owner Type
Purchase Details
Closed on
Dec 3, 2021
Sold by
Mohr Cynthia D
Bought by
Kempton Jeffery and Kempton Jessica Ann
Current Estimated Value
Home Financials for this Owner
Home Financials are based on the most recent Mortgage that was taken out on this home.
Original Mortgage
$247,000
Outstanding Balance
$227,114
Interest Rate
3.09%
Mortgage Type
New Conventional
Estimated Equity
$81,402
Purchase Details
Closed on
Feb 22, 2017
Sold by
Mohr Cynthia D and Mohr Kimberly M
Bought by
Mohr Cynthia D
Purchase Details
Closed on
Jul 13, 2004
Sold by
Dominion Homes Inc
Bought by
Mohr Kimberly M and Mohr Cynthia D
Home Financials for this Owner
Home Financials are based on the most recent Mortgage that was taken out on this home.
Original Mortgage
$174,267
Interest Rate
6.37%
Mortgage Type
FHA
Create a Home Valuation Report for This Property
The Home Valuation Report is an in-depth analysis detailing your home's value as well as a comparison with similar homes in the area
Home Values in the Area
Average Home Value in this Area
Purchase History
| Date | Buyer | Sale Price | Title Company |
|---|---|---|---|
| Kempton Jeffery | $260,000 | Northwest Ttl Fam Of Compani | |
| Mohr Cynthia D | -- | None Available | |
| Mohr Kimberly M | $175,700 | Alliance Ti |
Source: Public Records
Mortgage History
| Date | Status | Borrower | Loan Amount |
|---|---|---|---|
| Open | Kempton Jeffery | $247,000 | |
| Previous Owner | Mohr Kimberly M | $174,267 |
Source: Public Records
Tax History Compared to Growth
Tax History
| Year | Tax Paid | Tax Assessment Tax Assessment Total Assessment is a certain percentage of the fair market value that is determined by local assessors to be the total taxable value of land and additions on the property. | Land | Improvement |
|---|---|---|---|---|
| 2024 | $3,128 | $85,790 | $23,630 | $62,160 |
| 2023 | $3,073 | $85,785 | $23,625 | $62,160 |
| 2022 | $2,631 | $53,900 | $8,050 | $45,850 |
| 2021 | $2,683 | $53,900 | $8,050 | $45,850 |
| 2020 | $2,668 | $53,900 | $8,050 | $45,850 |
| 2019 | $2,527 | $45,050 | $6,720 | $38,330 |
| 2018 | $2,610 | $45,050 | $6,720 | $38,330 |
| 2017 | $2,504 | $45,050 | $6,720 | $38,330 |
| 2016 | $2,704 | $44,700 | $8,680 | $36,020 |
| 2015 | $2,704 | $44,700 | $8,680 | $36,020 |
| 2014 | $2,707 | $44,700 | $8,680 | $36,020 |
| 2013 | $1,492 | $49,665 | $9,660 | $40,005 |
Source: Public Records
Map
Nearby Homes
- 4518 Hall Rd
- 4459 Amwood St
- 4848 Deephollow Dr
- 4483 White Leaf Way
- 829 Crevis Ln
- 4715 Sullivant Ave Unit 46
- 4789 Dolan Place
- 4201 Sexton Dr
- 4190 Salem Dr
- 4212 Sexton Dr
- 4950 Cherry Creek Pkwy S
- 4146 Sexton Dr
- 673 Roth Ave
- 4220 Atlanta Dr
- 4763 Hafey Ave
- 4419 Hammerton Dr Unit 13D
- 4778 Hafey Ave
- 488 Lombard Rd
- 1800 Georgesville Square Dr
- 4655 Parkwick Dr
- 996 Rowland Ave
- 988 Rowland Ave
- 988 Rowland Ave Unit 28
- 1004 Rowland Ave
- 1004 Rowland Ave Unit 30
- 980 Rowland Ave
- 980 Rowland Ave Unit 27
- 1012 Rowland Ave
- 995 Tenbrook Place
- 995 Tenbrook Place Unit 42
- 987 Tenbrook Place
- 987 Tenbrook Place Unit 43
- 1003 Tenbrook Place
- 1003 Tenbrook Place Unit 41
- 979 Tenbrook Place
- 979 Tenbrook Place Unit 44
- 972 Rowland Ave
- 972 Rowland Ave Unit 26
- 997 Rowland Ave
- 997 Rowland Ave Unit 15