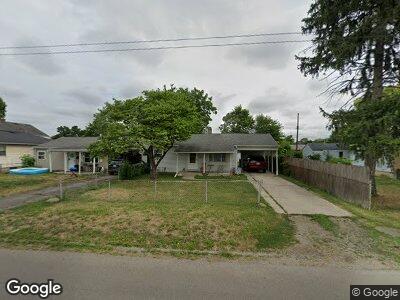
996 Thomas Ave Columbus, OH 43223
Franklinton NeighborhoodEstimated Value: $69,000 - $161,000
2
Beds
1
Bath
672
Sq Ft
$171/Sq Ft
Est. Value
About This Home
This home is located at 996 Thomas Ave, Columbus, OH 43223 and is currently estimated at $114,773, approximately $170 per square foot. 996 Thomas Ave is a home located in Franklin County with nearby schools including Sullivant Elementary School, Starling PK-8, and West High School.
Ownership History
Date
Name
Owned For
Owner Type
Purchase Details
Closed on
Aug 2, 2024
Sold by
Bravo Cesar and Arriaga Adriana
Bought by
Casa Bravo Properties Llc
Current Estimated Value
Home Financials for this Owner
Home Financials are based on the most recent Mortgage that was taken out on this home.
Original Mortgage
$123,750
Outstanding Balance
$123,226
Interest Rate
6.89%
Mortgage Type
Credit Line Revolving
Estimated Equity
-$15,355
Purchase Details
Closed on
Sep 9, 2022
Sold by
Michael Glen W and Michael Cheryl A
Bought by
Bravo Cesar and Arriaga Adriana
Purchase Details
Closed on
Jun 9, 2009
Sold by
Babylon Janice A
Bought by
Michael Glen W and Michael Cheryl A
Purchase Details
Closed on
Jul 14, 2008
Sold by
Babylon Janice A and The Trust Of Raymond R & Lois
Bought by
Babylon Janice A
Purchase Details
Closed on
Sep 24, 1992
Bought by
Righter Raymond R
Purchase Details
Closed on
Aug 28, 1987
Create a Home Valuation Report for This Property
The Home Valuation Report is an in-depth analysis detailing your home's value as well as a comparison with similar homes in the area
Home Values in the Area
Average Home Value in this Area
Purchase History
| Date | Buyer | Sale Price | Title Company |
|---|---|---|---|
| Casa Bravo Properties Llc | -- | First American Title Insurance | |
| Bravo Cesar | $48,500 | Northwest Advantage Title Agen | |
| Michael Glen W | -- | Attorney | |
| Babylon Janice A | -- | Attorney | |
| Righter Raymond R | -- | -- | |
| -- | -- | -- |
Source: Public Records
Mortgage History
| Date | Status | Borrower | Loan Amount |
|---|---|---|---|
| Open | Casa Bravo Properties Llc | $123,750 |
Source: Public Records
Tax History Compared to Growth
Tax History
| Year | Tax Paid | Tax Assessment Tax Assessment Total Assessment is a certain percentage of the fair market value that is determined by local assessors to be the total taxable value of land and additions on the property. | Land | Improvement |
|---|---|---|---|---|
| 2024 | $1,789 | $39,030 | $7,110 | $31,920 |
| 2023 | $1,920 | $39,025 | $7,105 | $31,920 |
| 2022 | $1,828 | $15,580 | $1,610 | $13,970 |
| 2021 | $877 | $15,580 | $1,610 | $13,970 |
| 2020 | $831 | $15,580 | $1,610 | $13,970 |
| 2019 | $828 | $12,990 | $1,330 | $11,660 |
| 2018 | $758 | $12,990 | $1,330 | $11,660 |
| 2017 | $881 | $12,990 | $1,330 | $11,660 |
| 2016 | $780 | $11,480 | $1,890 | $9,590 |
| 2015 | $710 | $11,480 | $1,890 | $9,590 |
| 2014 | $712 | $11,480 | $1,890 | $9,590 |
| 2013 | $512 | $12,740 | $2,100 | $10,640 |
Source: Public Records
Map
Nearby Homes
- 1043 Bellows Ave
- 339 Avondale Ave
- 901 Campbell Ave
- 308 S Cypress Ave
- 0 Bellows Ave
- 286 Avondale Ave
- 374 S Yale Ave
- 273 Avondale Ave
- 863 Campbell Ave
- 278 S Glenwood Ave
- 870-872 Sullivant Ave
- 415 Nace Ave
- 818 Bellows Ave
- 288 S Yale Ave
- 295 S Yale Ave
- 489 Holton Ave
- 775 Bellows Ave Unit 777
- 185 S Cypress Ave
- 212 S Yale Ave Unit 214
- 743 Campbell Ave
- 996 Thomas Ave
- 1004 Thomas Ave
- 992 Thomas Ave
- 1012 Thomas Ave
- 1005 Campbell Ave
- 0 Campbell Ave
- 1011 Campbell Ave
- 999 Campbell Ave
- 436 Dakota Ave Unit 438
- 1015 Campbell Ave
- 1028 Thomas Ave
- 978 Thomas Ave
- 979 Campbell Ave
- 976 Thomas Ave
- 975 Campbell Ave
- 975 1/2 Campbell Ave
- 975 Campbell Ave Unit 1/2
- 972 Thomas Ave
- 0 Campbell Ave
- 437 Dakota Ave