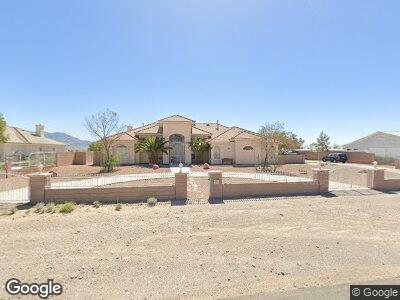
9960 N El Capitan Way Las Vegas, NV 89143
Kyle Canyon NeighborhoodEstimated Value: $862,000 - $1,362,000
3
Beds
3
Baths
2,985
Sq Ft
$352/Sq Ft
Est. Value
About This Home
This home is located at 9960 N El Capitan Way, Las Vegas, NV 89143 and is currently estimated at $1,052,133, approximately $352 per square foot. 9960 N El Capitan Way is a home located in Clark County with nearby schools including Thomas O'Roarke Elementary School, Ralph Cadwallader Middle School, and Arbor View High School.
Ownership History
Date
Name
Owned For
Owner Type
Purchase Details
Closed on
Dec 13, 2002
Sold by
Deutsche Bank National Trust Company
Bought by
Golding Lance and Golding Debora
Current Estimated Value
Home Financials for this Owner
Home Financials are based on the most recent Mortgage that was taken out on this home.
Original Mortgage
$289,000
Outstanding Balance
$127,330
Interest Rate
5.86%
Estimated Equity
$914,629
Purchase Details
Closed on
Jul 15, 2002
Sold by
Grundy Alisha
Bought by
Long Beach Mtg Loan Trust 2001 & 2
Purchase Details
Closed on
Jan 9, 2002
Sold by
Grundy Alisha
Bought by
Long Beach Mtg Loan Trust 2001 & 2
Purchase Details
Closed on
Apr 17, 2000
Sold by
Fourth Mesa Inc
Bought by
Grundy Alisha
Home Financials for this Owner
Home Financials are based on the most recent Mortgage that was taken out on this home.
Original Mortgage
$310,160
Interest Rate
11.25%
Create a Home Valuation Report for This Property
The Home Valuation Report is an in-depth analysis detailing your home's value as well as a comparison with similar homes in the area
Home Values in the Area
Average Home Value in this Area
Purchase History
| Date | Buyer | Sale Price | Title Company |
|---|---|---|---|
| Golding Lance | $340,000 | First American Title Co | |
| Long Beach Mtg Loan Trust 2001 & 2 | $407,390 | Fidelity National Title | |
| Long Beach Mtg Loan Trust 2001 & 2 | $382,295 | United Title | |
| Grundy Alisha | $364,900 | Lawyers Title |
Source: Public Records
Mortgage History
| Date | Status | Borrower | Loan Amount |
|---|---|---|---|
| Open | Golding Lance | $289,000 | |
| Previous Owner | Grundy Alisha | $310,160 | |
| Closed | Grundy Alisha | $36,490 |
Source: Public Records
Tax History Compared to Growth
Tax History
| Year | Tax Paid | Tax Assessment Tax Assessment Total Assessment is a certain percentage of the fair market value that is determined by local assessors to be the total taxable value of land and additions on the property. | Land | Improvement |
|---|---|---|---|---|
| 2025 | $5,654 | $257,763 | $87,500 | $170,263 |
| 2024 | $5,236 | $257,763 | $87,500 | $170,263 |
| 2023 | $5,236 | $230,358 | $70,000 | $160,358 |
| 2022 | $4,848 | $207,513 | $61,250 | $146,263 |
| 2021 | $4,489 | $192,047 | $52,500 | $139,547 |
| 2020 | $4,165 | $191,014 | $52,500 | $138,514 |
| 2019 | $3,904 | $179,605 | $52,500 | $127,105 |
| 2018 | $3,725 | $168,390 | $45,500 | $122,890 |
| 2017 | $5,308 | $161,910 | $45,500 | $116,410 |
| 2016 | $3,486 | $136,958 | $42,000 | $94,958 |
| 2015 | $3,526 | $146,974 | $26,250 | $120,724 |
| 2014 | $3,425 | $121,330 | $21,000 | $100,330 |
Source: Public Records
Map
Nearby Homes
- 9990 Four Views St
- 0 Ruston Rd
- 0 Homestead
- 8530 Ruston Rd
- 8928 Reining Spur Ave
- 9504 Empire Rock St
- 00 Homestead Rd
- 8575 Nicholas James Ave
- 9844 Red Horse St
- 9144 Black Elk Ave
- 9104 Blue Raven Ave
- 9350 Homestead Rd
- 9301 Harrow Rock St
- 8356 Shady Lady Ct
- 8809 Barium Rock Ave
- 8348 Mountain Destiny Ave
- 9732 Abel Cliff St
- 9239 Albus Hill Ave
- 9046 Barium Rock Ave
- 8335 Browns Mountain Ct
- 9960 N El Capitan Way
- 9990 N El Capitan Way
- 9930 N El Capitan Way
- 9900 N El Capitan Way
- 9940 Four Views St
- 9930 Four Views St
- 9910 Four Views St
- 8730 Ruston Rd
- 8750 Ruston Rd
- 8720 Ruston Rd
- 8710 Ruston Rd
- 9720 Miniature St
- 8808 Broodmare Ave
- 10210 Four Views St
- 10201 Four Views St
- 8812 Broodmare Ave Unit 2
- 9716 Miniature St Unit 2
- 8781 Rocky Ave
- 8707 Rocky Ave
- 8816 Broodmare Ave