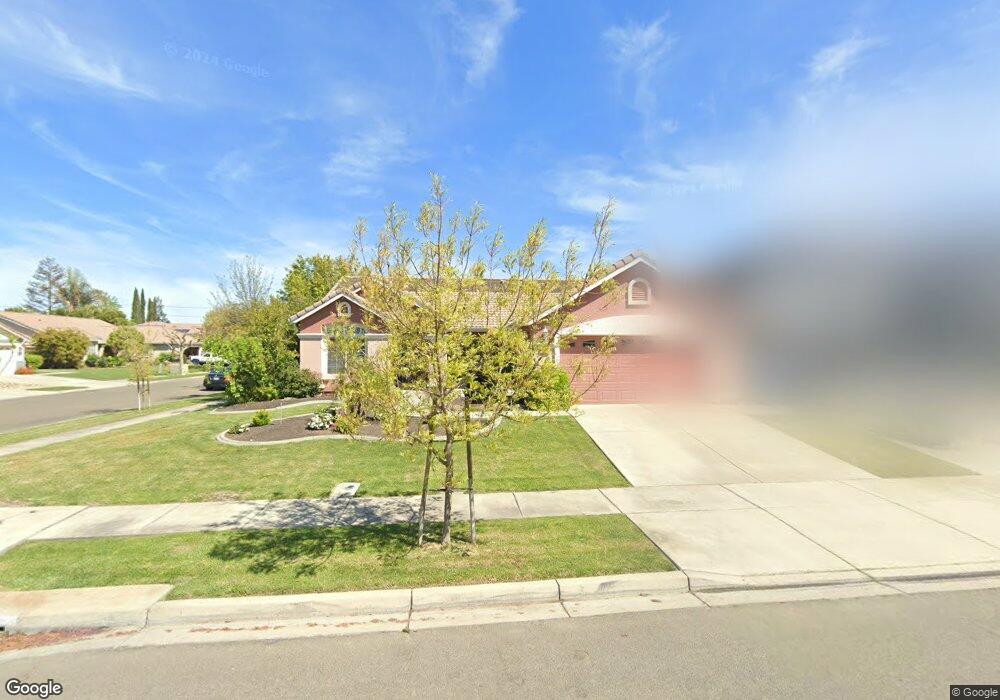
997 Sandy Way Turlock, CA 95382
Estimated Value: $534,000 - $560,566
3
Beds
2
Baths
1,778
Sq Ft
$308/Sq Ft
Est. Value
About This Home
This home is located at 997 Sandy Way, Turlock, CA 95382 and is currently estimated at $546,892, approximately $307 per square foot. 997 Sandy Way is a home located in Stanislaus County with nearby schools including Sandra Tovar Medeiros Elementary School, Turlock Junior High School, and Marvin A. Dutcher Middle School.
Ownership History
Date
Name
Owned For
Owner Type
Purchase Details
Closed on
Aug 6, 2020
Sold by
Hooper Charles E and Hooper Wanda J
Bought by
Torosyan Artur and Torosyan Chantel
Current Estimated Value
Home Financials for this Owner
Home Financials are based on the most recent Mortgage that was taken out on this home.
Original Mortgage
$360,000
Outstanding Balance
$318,022
Interest Rate
2.9%
Mortgage Type
New Conventional
Estimated Equity
$228,870
Purchase Details
Closed on
Feb 27, 2014
Sold by
Hooper Wanda J and Hooper Charles E
Bought by
Hooper 2014 Revocable Trust
Purchase Details
Closed on
May 11, 2000
Sold by
The Fitzpatrick Company
Bought by
Hooper Charles E and Hooper Wanda J
Home Financials for this Owner
Home Financials are based on the most recent Mortgage that was taken out on this home.
Original Mortgage
$152,100
Interest Rate
8.37%
Create a Home Valuation Report for This Property
The Home Valuation Report is an in-depth analysis detailing your home's value as well as a comparison with similar homes in the area
Purchase History
| Date | Buyer | Sale Price | Title Company |
|---|---|---|---|
| Torosyan Artur | $400,000 | North American Title Co Inc | |
| Hooper 2014 Revocable Trust | -- | None Available | |
| Hooper Charles E | $190,500 | Chicago Title Co |
Source: Public Records
Mortgage History
| Date | Status | Borrower | Loan Amount |
|---|---|---|---|
| Open | Torosyan Artur | $360,000 | |
| Previous Owner | Hooper Charles E | $152,100 |
Source: Public Records
Tax History
| Year | Tax Paid | Tax Assessment Tax Assessment Total Assessment is a certain percentage of the fair market value that is determined by local assessors to be the total taxable value of land and additions on the property. | Land | Improvement |
|---|---|---|---|---|
| 2025 | $4,833 | $432,972 | $151,540 | $281,432 |
| 2024 | $4,807 | $424,483 | $148,569 | $275,914 |
| 2023 | $4,978 | $416,160 | $145,656 | $270,504 |
| 2022 | $4,914 | $408,000 | $142,800 | $265,200 |
| 2021 | $4,792 | $400,000 | $140,000 | $260,000 |
| 2020 | $3,414 | $282,160 | $64,334 | $217,826 |
| 2019 | $3,340 | $276,628 | $63,073 | $213,555 |
| 2018 | $3,335 | $271,205 | $61,837 | $209,368 |
| 2017 | $3,243 | $265,888 | $60,625 | $205,263 |
| 2016 | $3,046 | $260,676 | $59,437 | $201,239 |
| 2015 | $3,012 | $256,762 | $58,545 | $198,217 |
| 2014 | $2,977 | $251,734 | $57,399 | $194,335 |
Source: Public Records
Map
Nearby Homes
- 1232 Paseo Belleza
- 4184 Horizon Ct
- 1463 Estrella Way
- 4666 Treasure Ct
- 1360 Shady Ln Unit 923
- 1360 Shady Ln Unit 1022
- 4185 Pathway Ln
- 1950 Trail Way
- 1901 Geer Rd
- 2333 Old Rose Ln
- 1444 Waterthrush Way
- 5333 Geer Rd
- 1481 Bluethroat Dr
- 4213 Montara Dr
- 3503 Telluride Ln
- 3661 La Mancha Place
- 3072 Radford Way
- 3632 La Mancha Place
- 2500 W Barnhart Rd
- 3068 Radford Way
- 987 Sandy Way
- 4620 Magnolia Dr
- 977 Sandy Way
- 4630 Magnolia Dr
- 4601 Magnolia Dr
- 4611 Magnolia Dr
- 4581 Magnolia Dr
- 4627 Kirkes Dr
- 986 Sandy Way
- 967 Sandy Way
- 4621 Magnolia Dr
- 4561 Magnolia Dr
- 976 Sandy Way
- 4637 Kirkes Dr
- 4631 Magnolia Dr
- 4551 Magnolia Dr
- 966 Sandy Way
- 4647 Kirkes Dr
- 4650 Magnolia Dr
- 4641 Magnolia Dr
Your Personal Tour Guide
Ask me questions while you tour the home.