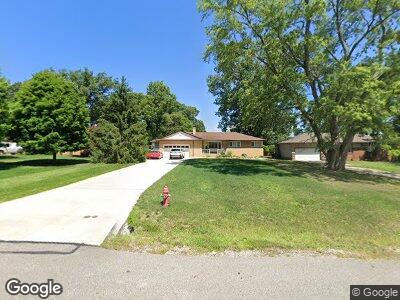
997 Twilight Dr Seven Hills, OH 44131
Estimated Value: $235,239 - $277,000
3
Beds
2
Baths
1,040
Sq Ft
$251/Sq Ft
Est. Value
About This Home
This home is located at 997 Twilight Dr, Seven Hills, OH 44131 and is currently estimated at $261,060, approximately $251 per square foot. 997 Twilight Dr is a home located in Cuyahoga County with nearby schools including Green Valley Elementary School, Hillside Middle School, and Normandy High School.
Ownership History
Date
Name
Owned For
Owner Type
Purchase Details
Closed on
Feb 20, 2021
Sold by
Oyster Craig
Bought by
Oyster Craig and Oyster Susan L
Current Estimated Value
Home Financials for this Owner
Home Financials are based on the most recent Mortgage that was taken out on this home.
Original Mortgage
$123,200
Outstanding Balance
$112,921
Interest Rate
2.7%
Mortgage Type
New Conventional
Estimated Equity
$140,576
Purchase Details
Closed on
Feb 23, 2000
Sold by
Coleman Blaine W and Coleman Judy L
Bought by
Oyster Craig
Home Financials for this Owner
Home Financials are based on the most recent Mortgage that was taken out on this home.
Original Mortgage
$137,015
Interest Rate
8.21%
Mortgage Type
FHA
Purchase Details
Closed on
Apr 21, 1977
Sold by
Schottke Donald and Schottke Kathleen
Bought by
Coleman Blaine W
Purchase Details
Closed on
Jan 1, 1975
Bought by
Schottke Donald and Schottke Kathleen
Create a Home Valuation Report for This Property
The Home Valuation Report is an in-depth analysis detailing your home's value as well as a comparison with similar homes in the area
Home Values in the Area
Average Home Value in this Area
Purchase History
| Date | Buyer | Sale Price | Title Company |
|---|---|---|---|
| Oyster Craig | -- | Servicelink | |
| Oyster Craig | $154,000 | Midland Title Security Inc | |
| Coleman Blaine W | $61,900 | -- | |
| Schottke Donald | -- | -- |
Source: Public Records
Mortgage History
| Date | Status | Borrower | Loan Amount |
|---|---|---|---|
| Open | Oyster Craig | $123,200 | |
| Closed | Oyster Craig | $22,500 | |
| Closed | Oyster Craig | $30,000 | |
| Closed | Oyster Craig L | $141,296 | |
| Closed | Oyster Craig L | $143,800 | |
| Closed | Oyster Craig | $137,015 | |
| Closed | Coleman Blaine W | $118,000 |
Source: Public Records
Tax History Compared to Growth
Tax History
| Year | Tax Paid | Tax Assessment Tax Assessment Total Assessment is a certain percentage of the fair market value that is determined by local assessors to be the total taxable value of land and additions on the property. | Land | Improvement |
|---|---|---|---|---|
| 2024 | $5,044 | $74,900 | $17,535 | $57,365 |
| 2023 | $4,821 | $62,550 | $15,720 | $46,830 |
| 2022 | $4,911 | $62,545 | $15,715 | $46,830 |
| 2021 | $4,929 | $62,550 | $15,720 | $46,830 |
| 2020 | $4,049 | $50,860 | $12,780 | $38,080 |
| 2019 | $3,903 | $145,300 | $36,500 | $108,800 |
| 2018 | $3,926 | $50,860 | $12,780 | $38,080 |
| 2017 | $4,113 | $49,640 | $11,100 | $38,540 |
| 2016 | $4,082 | $49,640 | $11,100 | $38,540 |
| 2015 | $3,798 | $49,640 | $11,100 | $38,540 |
| 2014 | $3,798 | $48,200 | $10,780 | $37,420 |
Source: Public Records
Map
Nearby Homes
- 718 Starlight Dr
- 1390 Parkview Dr
- 0 Hillside Rd
- 6862 Glenella Dr
- 2600 Greenlawn Dr
- 1071 Gettysburg Dr
- 3187 Jasmine Dr
- 7178 Hawthorn Trace
- 7214 Hawthorne Trace
- 1530 Sherman Dr
- 7417 Broadview Rd
- 7480 Ludwin Dr
- 4610 Chestnut Rd
- 0 V L Gene Dr
- 200 Village Dr Unit 15
- 6372 Tanglewood Ln
- 6453 Poplar Dr
- 196 E Ridgewood Dr
- 6313 Gale Dr
- 1159 Orchardview Rd
- 997 Twilight Dr
- 1025 Twilight Dr
- 969 Twilight Dr
- 941 Twilight Dr
- 1055 Twilight Dr
- 994 Starlight Dr
- 1024 Starlight Dr
- 970 Starlight Dr
- 917 Twilight Dr
- 1085 Twilight Dr
- 940 Starlight Dr
- 1050 Starlight Dr
- 994 Twilight Dr
- 1024 Twilight Dr
- 970 Twilight Dr
- 891 Twilight Dr
- 918 Starlight Dr
- 940 Twilight Dr
- 1050 Twilight Dr
- 1084 Starlight Dr