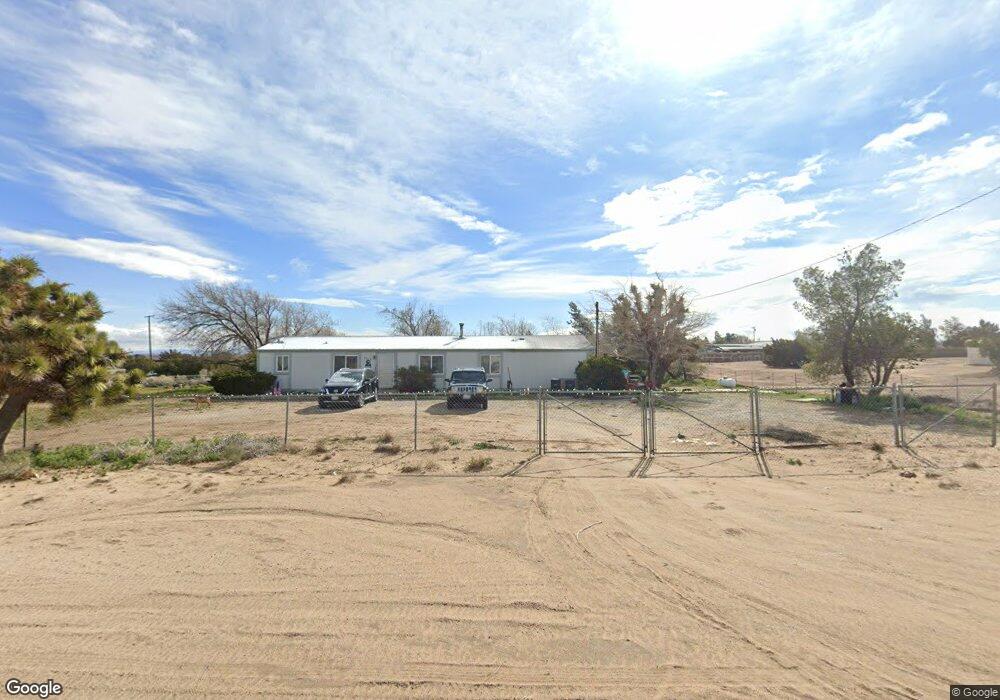
9975 Buttemere Rd Phelan, CA 92371
Estimated Value: $289,000 - $439,818
4
Beds
2
Baths
1,584
Sq Ft
$235/Sq Ft
Est. Value
About This Home
This home is located at 9975 Buttemere Rd, Phelan, CA 92371 and is currently estimated at $372,705, approximately $235 per square foot. 9975 Buttemere Rd is a home located in San Bernardino County with nearby schools including Baldy Mesa Elementary School, Quail Valley Middle School, and Serrano High School.
Ownership History
Date
Name
Owned For
Owner Type
Purchase Details
Closed on
Aug 21, 2023
Sold by
Bae Young Soo
Bought by
Bae Family Trust and Bae
Current Estimated Value
Purchase Details
Closed on
Mar 28, 2011
Sold by
Bae Ki Hae
Bought by
Bae Young S
Purchase Details
Closed on
Mar 24, 2011
Sold by
Wells Fargo Financial California Inc
Bought by
Bae Young S
Purchase Details
Closed on
Jan 21, 2011
Sold by
Mcfadden Reba L
Bought by
Wells Fargo Financial California Inc
Purchase Details
Closed on
Oct 17, 2000
Sold by
Glick Joseph Anthony and Glick Effie Jeannette
Bought by
Ferguson Jack A and Mcfadden Reba L
Home Financials for this Owner
Home Financials are based on the most recent Mortgage that was taken out on this home.
Original Mortgage
$40,000
Interest Rate
7.82%
Create a Home Valuation Report for This Property
The Home Valuation Report is an in-depth analysis detailing your home's value as well as a comparison with similar homes in the area
Home Values in the Area
Average Home Value in this Area
Purchase History
| Date | Buyer | Sale Price | Title Company |
|---|---|---|---|
| Bae Family Trust | -- | None Listed On Document | |
| Bae Young S | -- | First American Title Company | |
| Bae Young S | $63,500 | First American Title Company | |
| Wells Fargo Financial California Inc | $22,018 | Accommodation | |
| Ferguson Jack A | $70,000 | Commonwealth Land Title Co |
Source: Public Records
Mortgage History
| Date | Status | Borrower | Loan Amount |
|---|---|---|---|
| Previous Owner | Ferguson Jack A | $40,000 |
Source: Public Records
Tax History Compared to Growth
Tax History
| Year | Tax Paid | Tax Assessment Tax Assessment Total Assessment is a certain percentage of the fair market value that is determined by local assessors to be the total taxable value of land and additions on the property. | Land | Improvement |
|---|---|---|---|---|
| 2025 | $1,244 | $80,841 | $32,029 | $48,812 |
| 2024 | $1,244 | $79,256 | $31,401 | $47,855 |
| 2023 | $1,229 | $77,702 | $30,785 | $46,917 |
| 2022 | $1,203 | $76,178 | $30,181 | $45,997 |
| 2021 | $1,182 | $74,684 | $29,589 | $45,095 |
| 2020 | $1,168 | $73,919 | $29,286 | $44,633 |
| 2019 | $1,150 | $72,470 | $28,712 | $43,758 |
| 2018 | $977 | $71,049 | $28,149 | $42,900 |
| 2017 | $963 | $69,656 | $27,597 | $42,059 |
| 2016 | $952 | $68,290 | $27,056 | $41,234 |
| 2015 | $942 | $67,265 | $26,650 | $40,615 |
| 2014 | $921 | $65,947 | $26,128 | $39,819 |
Source: Public Records
Map
Nearby Homes
- 0 White Fox Unit CV25175535
- 0 White Fox Unit SW24090626
- 0 Yucca Terrace Dr Unit 25560019
- 7176 Phelan Rd
- 0 Avenal St Unit HD25056301
- 10139 Sonora Rd
- 9847 Sonora Rd
- 7653 Phelan Rd
- 7153 Cambria Rd
- 9561 Middleton Rd
- 0 Middleton Rd Unit HD25067742
- 6895 Coyote Rd
- 101 Phelan Rd
- 8420 Buttemere Rd
- 10625 Caughlin Rd
- 11300 Caughlin Rd
- 6966 Sunnyslope Rd
- 2 Middleton Rd
- 1 Middleton Rd
- 0 Mesa St Unit 25006916
- 9960 Buttemere Rd
- 7276 White Fox Trail
- 10025 Buttemere Rd
- 9976 Oxford Rd
- 7392 White Fox Trail
- 7276 Acacia Rd
- 9977 Arizona Ave
- 7352 Acacia Rd Unit 363
- 9883 Buttemere Rd
- 7395 White Fox Trail
- 7226 Acacia Rd
- 10033 Arizona Ave
- 7425 Acacia Rd
- 7444 White Fox Trail
- 7325 Yucca Terrace Dr
- 7432 Acacia Rd
- 0 White Fox Unit WS18022815
- 0 White Fox Trail Unit CC334817
- 0 White Fox Unit CV14078829
- 0 White Fox Unit CV16011708