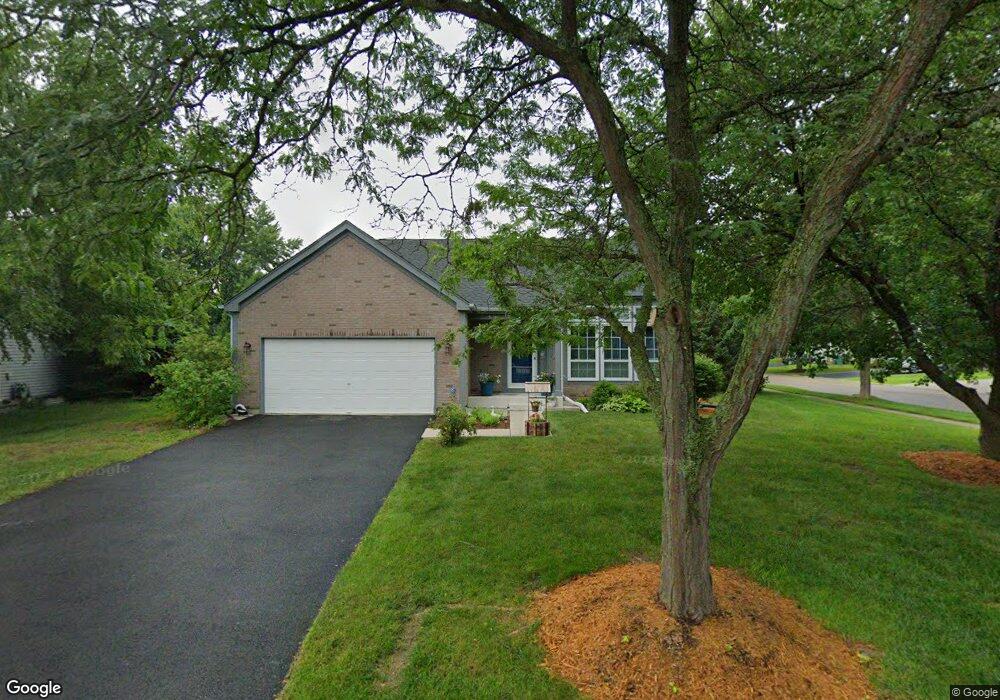
998 Dunhill Rd Unit 5 Grayslake, IL 60030
Estimated Value: $347,000 - $377,000
3
Beds
3
Baths
1,602
Sq Ft
$224/Sq Ft
Est. Value
About This Home
This home is located at 998 Dunhill Rd Unit 5, Grayslake, IL 60030 and is currently estimated at $359,370, approximately $224 per square foot. 998 Dunhill Rd Unit 5 is a home located in Lake County with nearby schools including Woodland Primary School, Woodland Elementary School, and Woodland Intermediate School.
Ownership History
Date
Name
Owned For
Owner Type
Purchase Details
Closed on
May 29, 2001
Sold by
Thews David and Thews Christi
Bought by
Mesmer Dean R and Mesmer Susan L
Current Estimated Value
Home Financials for this Owner
Home Financials are based on the most recent Mortgage that was taken out on this home.
Original Mortgage
$145,600
Outstanding Balance
$55,624
Interest Rate
7.18%
Estimated Equity
$303,746
Purchase Details
Closed on
Jul 28, 2000
Sold by
Czuba Edward George
Bought by
Thews David
Home Financials for this Owner
Home Financials are based on the most recent Mortgage that was taken out on this home.
Original Mortgage
$156,150
Interest Rate
8.24%
Purchase Details
Closed on
Feb 4, 2000
Sold by
Czuba Edward George and Czuba Henriette
Bought by
Czuba Edward George and Czuba Henriette
Purchase Details
Closed on
Sep 28, 1999
Sold by
Roemer Kurt R and Roemer Christine M
Bought by
Czuba Edward G and Czuba Henriette
Create a Home Valuation Report for This Property
The Home Valuation Report is an in-depth analysis detailing your home's value as well as a comparison with similar homes in the area
Home Values in the Area
Average Home Value in this Area
Purchase History
| Date | Buyer | Sale Price | Title Company |
|---|---|---|---|
| Mesmer Dean R | $182,000 | Chicago Title Insurance Co | |
| Thews David | $173,500 | Ticor Title | |
| Czuba Edward George | -- | -- | |
| Czuba Edward G | $166,500 | -- |
Source: Public Records
Mortgage History
| Date | Status | Borrower | Loan Amount |
|---|---|---|---|
| Open | Mesmer Dean R | $145,600 | |
| Previous Owner | Thews David | $156,150 |
Source: Public Records
Tax History Compared to Growth
Tax History
| Year | Tax Paid | Tax Assessment Tax Assessment Total Assessment is a certain percentage of the fair market value that is determined by local assessors to be the total taxable value of land and additions on the property. | Land | Improvement |
|---|---|---|---|---|
| 2024 | $8,234 | $92,338 | $25,534 | $66,804 |
| 2023 | $7,001 | $84,745 | $23,434 | $61,311 |
| 2022 | $7,001 | $73,182 | $17,009 | $56,173 |
| 2021 | $6,865 | $70,341 | $16,349 | $53,992 |
| 2020 | $7,351 | $73,590 | $15,556 | $58,034 |
| 2019 | $7,294 | $70,604 | $14,925 | $55,679 |
| 2018 | $8,328 | $75,003 | $18,361 | $56,642 |
| 2017 | $8,243 | $70,551 | $17,271 | $53,280 |
| 2016 | $7,895 | $65,126 | $15,943 | $49,183 |
| 2015 | $7,565 | $59,497 | $14,565 | $44,932 |
| 2014 | $7,398 | $57,137 | $13,893 | $43,244 |
| 2012 | $7,369 | $59,673 | $14,510 | $45,163 |
Source: Public Records
Map
Nearby Homes
- 23 Bobolink Dr
- 355 Buckingham Dr
- 399 Banbury Ln
- 1191 Hummingbird Ln
- 707 Crossland Dr
- 633 Dove Ct Unit 4
- 745 Dillon Ct
- 1617 Albany St
- 820 Amelia Ct
- 873 Essex Cir
- 33276 N Sunset Ave
- 33336 N Indian Ln
- 618 Barron Blvd
- 1045 Manchester Cir
- 418 Flanders Ln
- 146 Westerfield Place
- 390 N Garfield Blvd
- 18740 W Willow Point Dr
- 1544 Syracuse Dr
- 20295 W Washington St
- 994 Dunhill Rd
- 1068 Cambridge Dr
- 1051 Cambridge Dr
- 1078 Cambridge Dr
- 990 Dunhill Rd
- 1041 Cambridge Dr
- 1061 Cambridge Dr
- 997 Dunhill Rd
- 993 Dunhill Rd
- 1031 Cambridge Dr
- 142 Buckingham Dr
- 126 Buckingham Dr
- 986 Dunhill Rd
- 1088 Cambridge Dr
- 1021 Cambridge Dr
- 158 Buckingham Dr
- 1081 Cambridge Dr
- 981 Dunhill Rd
- 174 Buckingham Dr
- 1006 Cambridge Dr