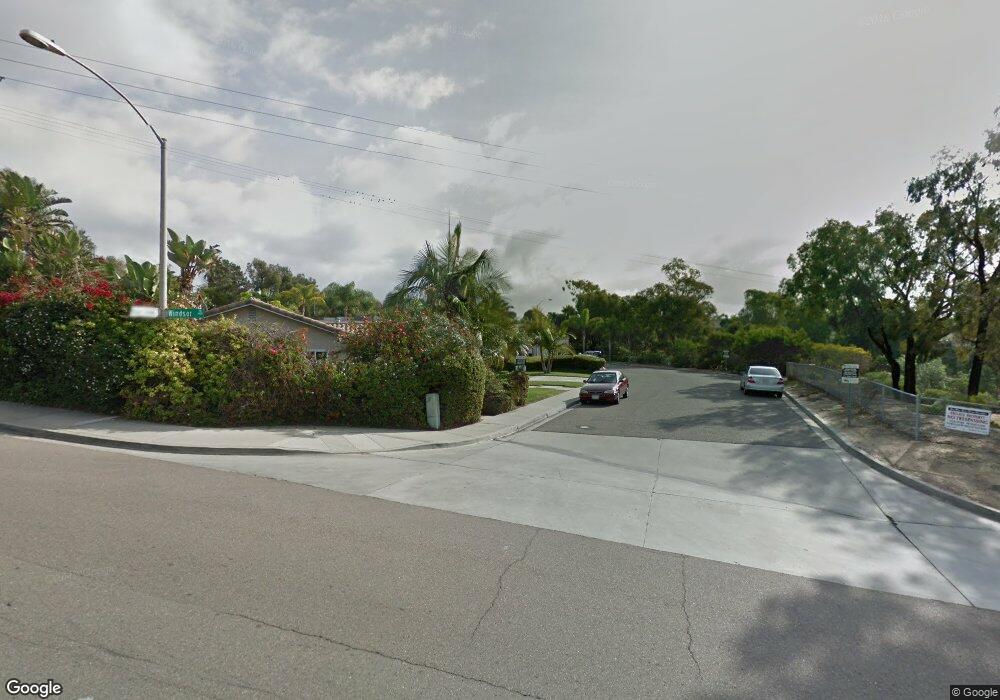
998 Windsor Creek Ct Cardiff By the Sea, CA 92007
Cardiff-by-the-Sea NeighborhoodEstimated Value: $1,854,000 - $2,537,000
2
Beds
2
Baths
2,727
Sq Ft
$819/Sq Ft
Est. Value
About This Home
This home is located at 998 Windsor Creek Ct, Cardiff By the Sea, CA 92007 and is currently estimated at $2,232,210, approximately $818 per square foot. 998 Windsor Creek Ct is a home located in San Diego County with nearby schools including Ada W. Harris Elementary, Cardiff Elementary, and Oak Crest Middle School.
Ownership History
Date
Name
Owned For
Owner Type
Purchase Details
Closed on
Dec 22, 2010
Sold by
Weikel Thomas F and Perea Sandra R
Bought by
Weikel Thomas F and Perea Sandra R
Current Estimated Value
Home Financials for this Owner
Home Financials are based on the most recent Mortgage that was taken out on this home.
Original Mortgage
$650,000
Outstanding Balance
$410,502
Interest Rate
3.37%
Mortgage Type
New Conventional
Estimated Equity
$1,821,708
Purchase Details
Closed on
Nov 3, 2005
Sold by
Weikel Thomas F and Perea Sandra R
Bought by
Weikel Thomas F and Perea Sandra R
Purchase Details
Closed on
Feb 19, 1999
Sold by
Mills Clifton W
Bought by
Weikel Thomas F and Perea Sandra R
Home Financials for this Owner
Home Financials are based on the most recent Mortgage that was taken out on this home.
Original Mortgage
$380,000
Interest Rate
6.62%
Purchase Details
Closed on
Nov 2, 1987
Create a Home Valuation Report for This Property
The Home Valuation Report is an in-depth analysis detailing your home's value as well as a comparison with similar homes in the area
Home Values in the Area
Average Home Value in this Area
Purchase History
| Date | Buyer | Sale Price | Title Company |
|---|---|---|---|
| Weikel Thomas F | -- | Accommodation | |
| Weikel Thomas F | -- | Chicago Title Company | |
| Weikel Thomas F | -- | -- | |
| Weikel Thomas F | $475,000 | Commonwealth Land Title Co | |
| -- | $80,000 | -- |
Source: Public Records
Mortgage History
| Date | Status | Borrower | Loan Amount |
|---|---|---|---|
| Open | Weikel Thomas F | $650,000 | |
| Previous Owner | Weikel Thomas F | $380,000 |
Source: Public Records
Tax History Compared to Growth
Tax History
| Year | Tax Paid | Tax Assessment Tax Assessment Total Assessment is a certain percentage of the fair market value that is determined by local assessors to be the total taxable value of land and additions on the property. | Land | Improvement |
|---|---|---|---|---|
| 2025 | $9,011 | $744,644 | $217,613 | $527,031 |
| 2024 | $9,011 | $730,045 | $213,347 | $516,698 |
| 2023 | $8,737 | $715,731 | $209,164 | $506,567 |
| 2022 | $8,940 | $701,698 | $205,063 | $496,635 |
| 2021 | $8,361 | $687,941 | $201,043 | $486,898 |
| 2020 | $8,256 | $680,888 | $198,982 | $481,906 |
| 2019 | $8,109 | $667,538 | $195,081 | $472,457 |
| 2018 | $7,892 | $654,450 | $191,256 | $463,194 |
| 2017 | $190 | $641,618 | $187,506 | $454,112 |
| 2016 | $7,455 | $629,038 | $183,830 | $445,208 |
| 2015 | $7,326 | $619,590 | $181,069 | $438,521 |
| 2014 | $7,188 | $607,454 | $177,523 | $429,931 |
Source: Public Records
Map
Nearby Homes
- 1320 Evergreen Dr
- 1373 Evergreen Dr
- 1246 Evergreen Dr
- 1543 Villa Cardiff Dr
- 1234 Caminito Septimo
- 1044 Nolbey St
- 1341 Caminito Septimo
- 1440 Mackinnon Ave
- 1386 Lake Dr
- 918 Emma Dr
- 1129 Bonita Dr
- 240 Birmingham Dr Unit 19 & 20
- 943-45 Windy Hill Terrace
- 1168 Arcadia Rd
- 1280 Santa fe Dr
- 417 Warwick Ave
- 1153 Crest Dr
- 943-45 Bracero Rd
- 943-45 Bracero Rd
- 407 Birmingham Dr
- 976 Windsor Creek Ct
- 985 Windsor Creek Ct
- 960 Windsor Creek Ct
- 942 Windsor Creek Ct
- 921 Woodlake Dr
- 917 Woodlake Dr
- 925 Woodlake Dr Unit 1
- 913 Woodlake Dr
- 929 Woodlake Dr
- 909 Woodlake Dr
- 934 Windsor Creek Ct
- 933 Woodlake Dr
- 905 Woodlake Dr
- 937 Woodlake Dr
- 941 Woodlake Dr
- 945 Woodlake Dr
- 918 Woodlake Dr
- 914 Woodlake Dr
- 949 Woodlake Dr
- 910 Woodlake Dr