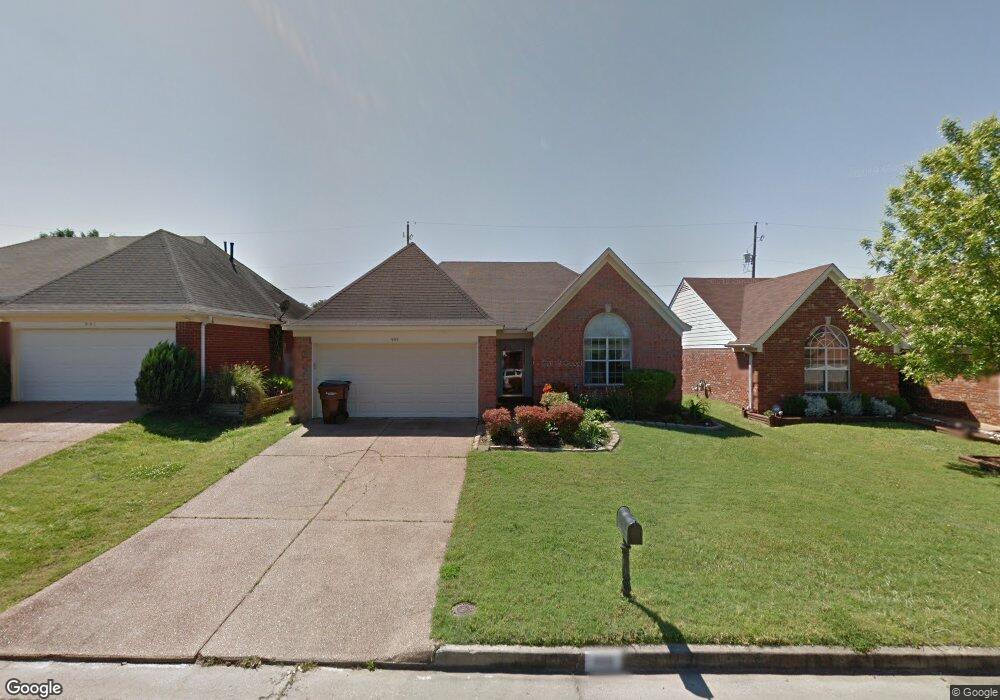
999 Jessa Cove Cordova, TN 38018
Cordova NeighborhoodEstimated Value: $223,977 - $246,000
3
Beds
2
Baths
1,552
Sq Ft
$149/Sq Ft
Est. Value
About This Home
This home is located at 999 Jessa Cove, Cordova, TN 38018 and is currently estimated at $231,744, approximately $149 per square foot. 999 Jessa Cove is a home located in Shelby County with nearby schools including Dexter Elementary School, Dexter Middle School, and Cordova High School.
Ownership History
Date
Name
Owned For
Owner Type
Purchase Details
Closed on
Feb 20, 2025
Sold by
Rei Nation Llc
Bought by
Waystar Holdings Llc
Current Estimated Value
Purchase Details
Closed on
Aug 30, 2024
Sold by
Griggs Rebecca Ann
Bought by
Rei Nation Llc
Purchase Details
Closed on
Nov 20, 2002
Sold by
Puckett John E and Puckett Sherry L
Bought by
Griggs Rebecca Ann
Home Financials for this Owner
Home Financials are based on the most recent Mortgage that was taken out on this home.
Original Mortgage
$99,120
Interest Rate
6.3%
Purchase Details
Closed on
Oct 24, 1997
Sold by
Paragon Properties Llc
Bought by
Puckett John E and Puckett Sherry L
Home Financials for this Owner
Home Financials are based on the most recent Mortgage that was taken out on this home.
Original Mortgage
$105,946
Interest Rate
7.39%
Mortgage Type
FHA
Create a Home Valuation Report for This Property
The Home Valuation Report is an in-depth analysis detailing your home's value as well as a comparison with similar homes in the area
Home Values in the Area
Average Home Value in this Area
Purchase History
| Date | Buyer | Sale Price | Title Company |
|---|---|---|---|
| Waystar Holdings Llc | -- | Title Insurance Company | |
| Rei Nation Llc | $182,500 | None Listed On Document | |
| Griggs Rebecca Ann | $123,900 | -- | |
| Puckett John E | $106,000 | Southern Escrow Title Compan | |
| Puckett John E | $106,000 | Southern Escrow Title Compan |
Source: Public Records
Mortgage History
| Date | Status | Borrower | Loan Amount |
|---|---|---|---|
| Previous Owner | Griggs Rebecca Ann | $99,120 | |
| Previous Owner | Puckett John E | $105,946 |
Source: Public Records
Tax History Compared to Growth
Tax History
| Year | Tax Paid | Tax Assessment Tax Assessment Total Assessment is a certain percentage of the fair market value that is determined by local assessors to be the total taxable value of land and additions on the property. | Land | Improvement |
|---|---|---|---|---|
| 2025 | -- | $60,125 | $8,750 | $51,375 |
| 2024 | $1,489 | $43,925 | $6,875 | $37,050 |
| 2023 | $1,489 | $43,925 | $6,875 | $37,050 |
| 2022 | $1,489 | $43,925 | $6,875 | $37,050 |
| 2021 | $1,515 | $43,925 | $6,875 | $37,050 |
| 2020 | $1,278 | $31,550 | $6,875 | $24,675 |
| 2019 | $1,278 | $31,550 | $6,875 | $24,675 |
| 2018 | $1,278 | $31,550 | $6,875 | $24,675 |
| 2017 | $1,297 | $31,550 | $6,875 | $24,675 |
| 2016 | $1,184 | $27,100 | $0 | $0 |
| 2014 | $1,184 | $27,100 | $0 | $0 |
Source: Public Records
Map
Nearby Homes
- 6890 Century Oaks Dr
- 6884 Wrigley Dr
- 6880 Wrigley Dr
- 7194 Charlton Way
- 7247 Winterbrook Ln
- 7303 Winterbrook Ln
- 6774 Whitten Pine Dr
- 1382 Exbury Dr
- 7420 Dal Whinnie Trail
- 6838 Lagrange Cir N
- 6916 Lagrange Pines Rd
- 7035 S Estacada Way
- 1089 Links View Ln W
- 887 Dalemore Ln
- 7468 Links View Ln S
- 7494 Links View Ln S
- 7486 Dal Whinnie Trail
- 7565 Wintergreen Ln
- 1277 Winter Springs Ln
- 1321 Winter Springs Ln
- 1003 Jessa Cove
- 991 Jessa Cove
- 1009 Jessa Cove
- 1000 Show Boat Cove
- 1004 Show Boat Cove
- 992 Show Boat Cove
- 998 Jessa Cove
- 1013 Jessa Cove
- 1004 Jessa Cove
- 990 Jessa Cove
- 1010 Show Boat Cove
- 6967 2133 Whitten Rd Ln
- 1010 Jessa Cove
- 6961 Show Boat Ln
- 6967 Show Boat Ln
- 1017 Jessa Cove
- 6961 Showboat Ln
- 1014 Show Boat Cove
- 6957 Show Boat Ln
- 6957 Showboat Ln