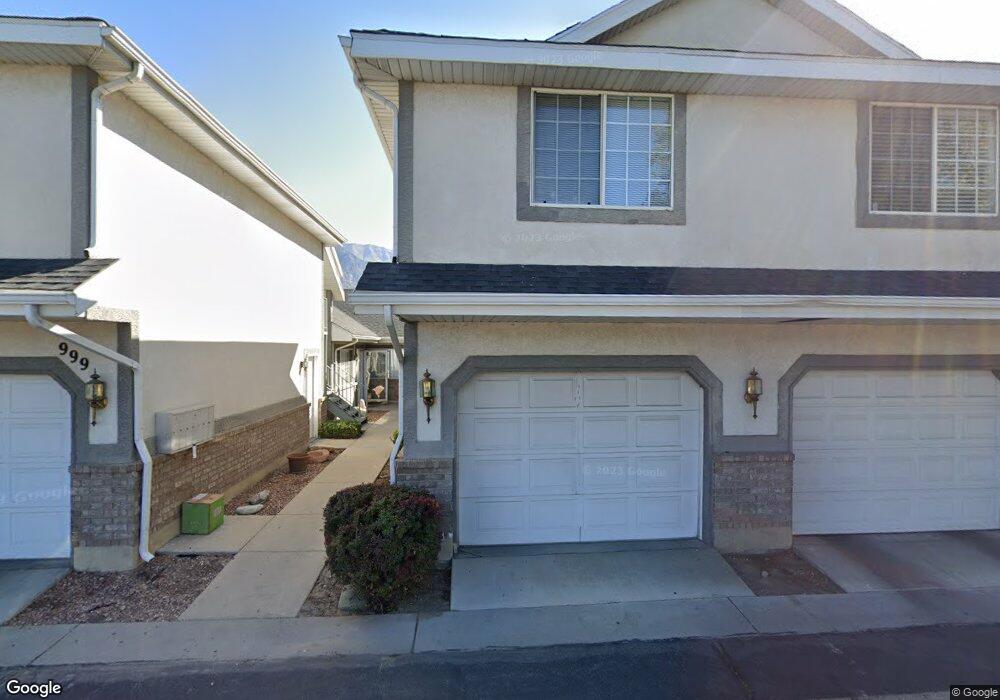
999 S 310 W Unit A Provo, UT 84601
Franklin NeighborhoodEstimated Value: $377,514 - $454,000
4
Beds
3
Baths
1,850
Sq Ft
$215/Sq Ft
Est. Value
About This Home
This home is located at 999 S 310 W Unit A, Provo, UT 84601 and is currently estimated at $397,879, approximately $215 per square foot. 999 S 310 W Unit A is a home located in Utah County with nearby schools including Spring Creek Elementary School, Centennial Middle School, and Timpview High School.
Ownership History
Date
Name
Owned For
Owner Type
Purchase Details
Closed on
Mar 6, 2024
Sold by
Stelzer One Rental Property Llc
Bought by
Hill Maxwell Silas
Current Estimated Value
Home Financials for this Owner
Home Financials are based on the most recent Mortgage that was taken out on this home.
Original Mortgage
$320,000
Outstanding Balance
$314,737
Interest Rate
6.69%
Mortgage Type
New Conventional
Estimated Equity
$83,142
Purchase Details
Closed on
Jul 27, 2017
Sold by
Stelzer Guilherme R
Bought by
Stelzer One Rental Property Llc
Purchase Details
Closed on
Jun 7, 2014
Sold by
Dbpt Llc
Bought by
Stelzer Guilherme R
Home Financials for this Owner
Home Financials are based on the most recent Mortgage that was taken out on this home.
Original Mortgage
$180,000
Interest Rate
4.03%
Purchase Details
Closed on
Sep 8, 2009
Sold by
Bergin Marian S and Bergin Allen E
Bought by
Dbpt Llc
Purchase Details
Closed on
Jun 28, 2002
Sold by
Wells Fargo Bank Na
Bought by
Bergin Allen E and Bergin Marian S
Create a Home Valuation Report for This Property
The Home Valuation Report is an in-depth analysis detailing your home's value as well as a comparison with similar homes in the area
Home Values in the Area
Average Home Value in this Area
Purchase History
| Date | Buyer | Sale Price | Title Company |
|---|---|---|---|
| Hill Maxwell Silas | -- | Inwest Title | |
| Stelzer One Rental Property Llc | -- | None Available | |
| Stelzer Guilherme R | -- | None Available | |
| Dbpt Llc | -- | Accommodation | |
| Bergin Allen E | -- | -- |
Source: Public Records
Mortgage History
| Date | Status | Borrower | Loan Amount |
|---|---|---|---|
| Open | Hill Maxwell Silas | $320,000 | |
| Previous Owner | Stelzer Guilherme R | $180,000 |
Source: Public Records
Tax History Compared to Growth
Tax History
| Year | Tax Paid | Tax Assessment Tax Assessment Total Assessment is a certain percentage of the fair market value that is determined by local assessors to be the total taxable value of land and additions on the property. | Land | Improvement |
|---|---|---|---|---|
| 2025 | $1,788 | $174,405 | $35,200 | $281,900 |
| 2024 | $1,788 | $176,000 | $0 | $0 |
| 2023 | $1,889 | $183,315 | $0 | $0 |
| 2022 | $1,591 | $155,705 | $0 | $0 |
| 2021 | $1,338 | $228,300 | $27,400 | $200,900 |
| 2020 | $1,320 | $211,100 | $25,300 | $185,800 |
| 2019 | $1,149 | $191,100 | $26,000 | $165,100 |
| 2018 | $973 | $164,200 | $24,000 | $140,200 |
| 2017 | $974 | $90,310 | $0 | $0 |
| 2016 | $967 | $83,600 | $0 | $0 |
| 2015 | $869 | $75,900 | $0 | $0 |
| 2014 | $834 | $75,900 | $0 | $0 |
Source: Public Records
Map
Nearby Homes
- 272 W 1020 S Unit B
- 933 S Blvd W
- 1095 S 500 W Unit 11
- 751 S 400 W
- 151 S Meadow Dr Unit 19
- 151 S Meadow Dr
- 648 S 500 W Unit 4
- 608 S 500 W Unit 3
- 330 W 600 S
- 1125 S 770 W
- 516 S Freedom Blvd
- 655 W 1280 S
- 389 W 500 S
- 590 S 600 W
- 475 S 400 W Unit D1
- 491 S Freedom Blvd Unit 104204
- 461 S 400 W
- 784 W Heather Ln
- 3404 W 1500 N
- 761 W 600 S Unit 12
- 999 S 310 W
- 999 S 310 W Unit D
- 999 S 310 W Unit C
- 999 S 310 W Unit B
- 999 S 310 W
- 999 S 310 W Unit F
- 999 S 310 W Unit C
- 999 S 310 W Unit 4
- 971 S 310 W Unit B
- 971 S 310 W Unit A
- 971 S 310 W Unit B
- 971 S 310 W Unit D
- 971 S 310 W Unit C
- 971 S 310 W Unit F
- 971 S 310 W
- 272 W 1020 S Unit E
- 272 W 1020 S Unit D
- 272 W 1020 S Unit C
- 272 W 1020 S
- 272 W 1020 S Unit F