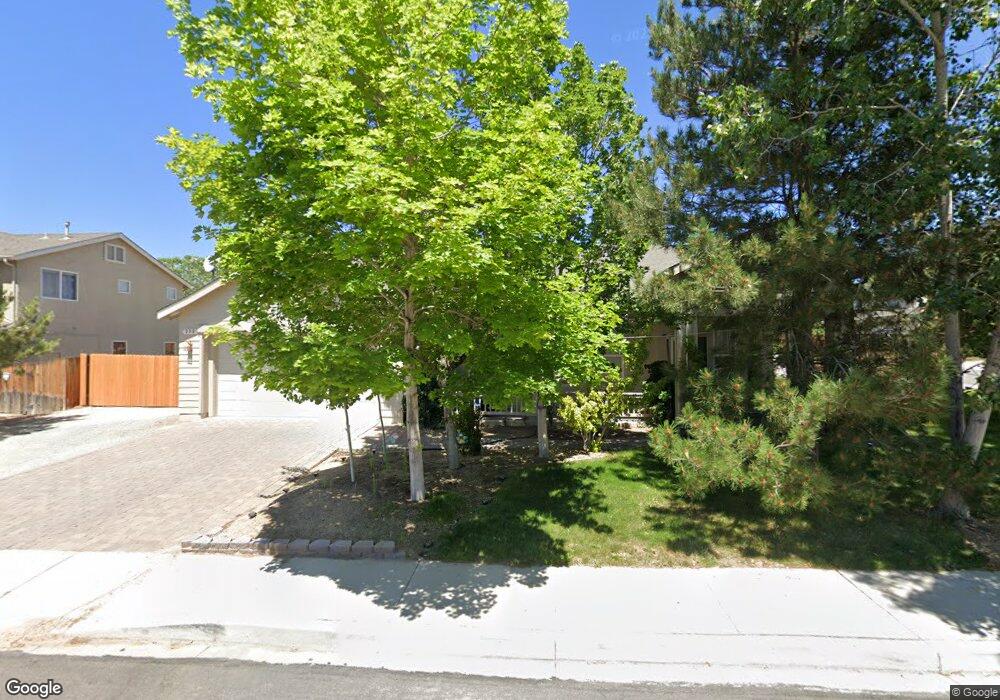
999 S University Park Loop Reno, NV 89512
West University NeighborhoodEstimated Value: $535,000 - $590,000
3
Beds
2
Baths
1,616
Sq Ft
$354/Sq Ft
Est. Value
About This Home
This home is located at 999 S University Park Loop, Reno, NV 89512 and is currently estimated at $572,108, approximately $354 per square foot. 999 S University Park Loop is a home located in Washoe County with nearby schools including Peavine Elementary School, Archie Clayton Pre-AP Academy, and Coral Academy Charter School Elementary.
Ownership History
Date
Name
Owned For
Owner Type
Purchase Details
Closed on
Apr 13, 2020
Sold by
Mcglynn Daniel W and Price Dwan M
Bought by
Mcglynn Daniel W and Price Dawn M
Current Estimated Value
Home Financials for this Owner
Home Financials are based on the most recent Mortgage that was taken out on this home.
Original Mortgage
$275,175
Outstanding Balance
$241,755
Interest Rate
3.2%
Mortgage Type
New Conventional
Estimated Equity
$330,353
Purchase Details
Closed on
Mar 8, 2005
Sold by
Bgu Associates Llc
Bought by
Mcglynn Daniel and Price Dwan
Home Financials for this Owner
Home Financials are based on the most recent Mortgage that was taken out on this home.
Original Mortgage
$273,500
Interest Rate
6.37%
Mortgage Type
Unknown
Create a Home Valuation Report for This Property
The Home Valuation Report is an in-depth analysis detailing your home's value as well as a comparison with similar homes in the area
Home Values in the Area
Average Home Value in this Area
Purchase History
| Date | Buyer | Sale Price | Title Company |
|---|---|---|---|
| Mcglynn Daniel W | -- | North American Title Nv Reno | |
| Mcglynn Daniel | $342,000 | Founders Title Company Of Nv |
Source: Public Records
Mortgage History
| Date | Status | Borrower | Loan Amount |
|---|---|---|---|
| Open | Mcglynn Daniel W | $275,175 | |
| Closed | Mcglynn Daniel | $273,500 | |
| Closed | Mcglynn Daniel | $51,200 |
Source: Public Records
Tax History Compared to Growth
Tax History
| Year | Tax Paid | Tax Assessment Tax Assessment Total Assessment is a certain percentage of the fair market value that is determined by local assessors to be the total taxable value of land and additions on the property. | Land | Improvement |
|---|---|---|---|---|
| 2026 | $2,365 | $118,186 | $44,555 | $73,631 |
| 2025 | $3,069 | $119,367 | $44,555 | $74,812 |
| 2024 | $3,069 | $117,284 | $42,000 | $75,284 |
| 2023 | $2,164 | $114,860 | $43,750 | $71,110 |
| 2022 | $2,894 | $92,754 | $33,565 | $59,189 |
| 2021 | $2,680 | $84,014 | $25,200 | $58,814 |
| 2020 | $2,521 | $86,133 | $27,300 | $58,833 |
| 2019 | $2,401 | $81,883 | $24,938 | $56,945 |
| 2018 | $2,291 | $78,378 | $22,750 | $55,628 |
| 2017 | $2,199 | $74,028 | $18,375 | $55,653 |
| 2016 | $2,143 | $73,859 | $17,150 | $56,709 |
| 2015 | $2,139 | $72,598 | $15,750 | $56,848 |
| 2014 | $2,074 | $66,977 | $12,215 | $54,762 |
| 2013 | -- | $54,809 | $9,030 | $45,779 |
Source: Public Records
Map
Nearby Homes
- 1080 S University Park Loop
- 1120 University Park Ct
- 3510 Comstock Dr
- 3715 Coastal St
- 18 Colombard Way
- 3621 Pimlico St
- 27 Chianti Way
- 29 Chianti Way
- 3656 Ruidoso St
- 26 S Chardonnay St
- 93 Cabernet Pkwy
- 3566 Penn National Dr
- 970 Demos Ct
- 2135 Barberry Way
- 45 Chablis Dr
- 2140 Barberry Way
- 44 Chablis Dr
- 23 Chablis Dr
- 2735 Daffodil Way
- 1176 Arrastra Rd Unit Lot 16
- 2472 Weaver Place
- 3400 Weaver Place
- 991 S University Park Loop
- 998 S University Park Loop
- 1000 S University Park Loop
- 3407 Weaver Place
- 3408 Weaver Place
- 1010 S University Park Loop
- 981 S University Park Loop
- 3416 Weaver Place
- 1020 S University Park Loop
- 1025 S University Park Loop
- 3411 Weaver Place
- 3424 Weaver Place
- 1030 S University Park Loop
- 971 S University Park Loop
- 1034 S University Park Loop
- 1035 S University Park Loop
- 3419 Weaver Place
- 3432 Weaver Place