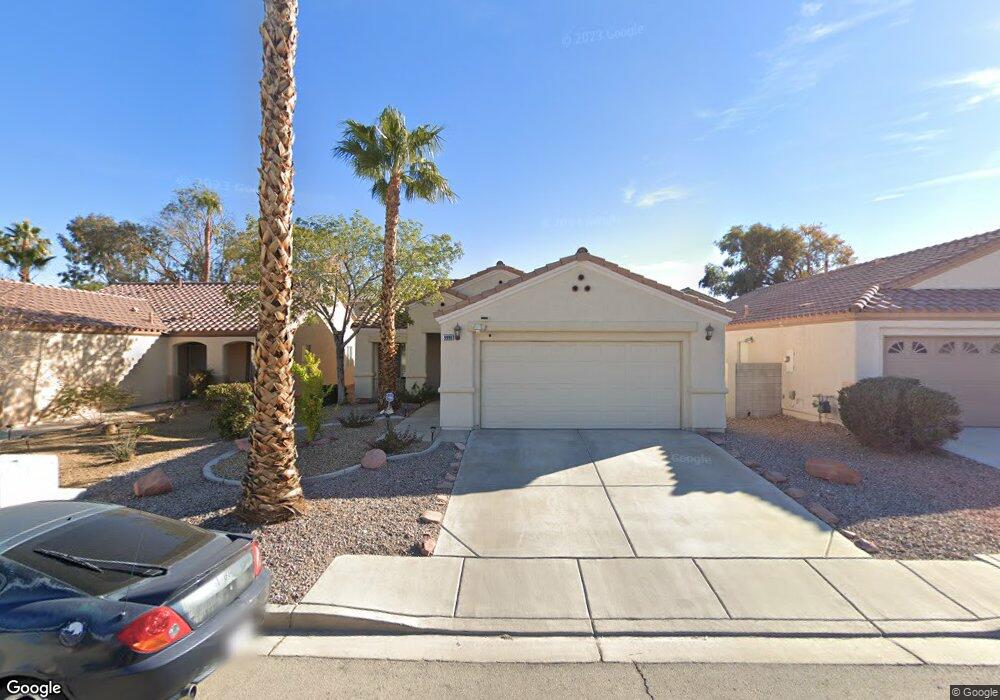
9990 Rose Charmont St Las Vegas, NV 89183
Silverado Ranch NeighborhoodEstimated Value: $386,191 - $431,000
3
Beds
2
Baths
1,308
Sq Ft
$313/Sq Ft
Est. Value
About This Home
This home is located at 9990 Rose Charmont St, Las Vegas, NV 89183 and is currently estimated at $409,798, approximately $313 per square foot. 9990 Rose Charmont St is a home located in Clark County with nearby schools including John R. Hummel Elementary School, Charles Silvestri Junior High School, and Liberty High School.
Ownership History
Date
Name
Owned For
Owner Type
Purchase Details
Closed on
Mar 2, 2004
Sold by
Nielsen Ty
Bought by
Nielsen Maria
Current Estimated Value
Home Financials for this Owner
Home Financials are based on the most recent Mortgage that was taken out on this home.
Original Mortgage
$175,500
Outstanding Balance
$82,480
Interest Rate
5.75%
Mortgage Type
New Conventional
Estimated Equity
$327,318
Purchase Details
Closed on
Nov 14, 2001
Sold by
Kim Jack Hill
Bought by
Nielsen Ty and Nielsen Maria
Home Financials for this Owner
Home Financials are based on the most recent Mortgage that was taken out on this home.
Original Mortgage
$147,584
Interest Rate
6.51%
Mortgage Type
FHA
Purchase Details
Closed on
Jul 27, 1999
Sold by
Kaufman & Broad Of Nevada Inc
Bought by
Kim Jack Hill
Home Financials for this Owner
Home Financials are based on the most recent Mortgage that was taken out on this home.
Original Mortgage
$119,939
Interest Rate
7.64%
Mortgage Type
FHA
Create a Home Valuation Report for This Property
The Home Valuation Report is an in-depth analysis detailing your home's value as well as a comparison with similar homes in the area
Home Values in the Area
Average Home Value in this Area
Purchase History
| Date | Buyer | Sale Price | Title Company |
|---|---|---|---|
| Nielsen Maria | -- | Lawyers Title Of Nevada | |
| Nielsen Ty | $147,900 | Old Republic Title Company | |
| Kim Jack Hill | $120,500 | United Title |
Source: Public Records
Mortgage History
| Date | Status | Borrower | Loan Amount |
|---|---|---|---|
| Open | Nielsen Maria | $175,500 | |
| Closed | Nielsen Ty | $147,584 | |
| Previous Owner | Kim Jack Hill | $119,939 |
Source: Public Records
Tax History Compared to Growth
Tax History
| Year | Tax Paid | Tax Assessment Tax Assessment Total Assessment is a certain percentage of the fair market value that is determined by local assessors to be the total taxable value of land and additions on the property. | Land | Improvement |
|---|---|---|---|---|
| 2025 | $1,577 | $95,205 | $39,550 | $55,655 |
| 2024 | $1,532 | $95,205 | $39,550 | $55,655 |
| 2023 | $1,532 | $85,491 | $32,900 | $52,591 |
| 2022 | $1,559 | $75,897 | $27,650 | $48,247 |
| 2021 | $1,444 | $73,511 | $27,650 | $45,861 |
| 2020 | $1,338 | $73,163 | $27,650 | $45,513 |
| 2019 | $1,254 | $64,496 | $19,600 | $44,896 |
| 2018 | $1,196 | $60,811 | $17,500 | $43,311 |
| 2017 | $1,781 | $60,715 | $16,800 | $43,915 |
| 2016 | $1,121 | $56,030 | $11,900 | $44,130 |
| 2015 | $1,118 | $38,123 | $8,050 | $30,073 |
| 2014 | $1,085 | $35,894 | $7,000 | $28,894 |
Source: Public Records
Map
Nearby Homes
- 10013 Solid Lime St
- 10025 Catseye Cove Ct
- 506 Green Gables Ave
- 638 Ribbon Grass Ave
- 9854 Canterbury Creek St
- 9801 Bradford Summit St
- 710 Elliot Peak Ave
- 10164 Tree Bark St
- 10133 Rice Paper St
- 10151 Tumbling Tree St
- 9792 Cordova Vista Ct
- 10142 Rice Paper St
- 555 E Silverado Ranch Blvd Unit 2075
- 555 E Silverado Ranch Blvd Unit 2130
- 555 E Silverado Ranch Blvd Unit 2168
- 555 E Silverado Ranch Blvd Unit 2064
- 555 E Silverado Ranch Blvd Unit 2086
- 555 E Silverado Ranch Blvd Unit 1017
- 555 E Silverado Ranch Blvd Unit 1123
- 555 E Silverado Ranch Blvd Unit 1172
- 10000 Rose Charmont St
- 9980 Rose Charmont St
- 10010 Rose Charmont St
- 9970 Rose Charmont St
- 9973 Solid Lime St
- 9963 Solid Lime St Unit n/a
- 9963 Solid Lime St
- 9983 Solid Lime St
- 580 Country Apple Ave
- 9960 Rose Charmont St
- 10020 Rose Charmont St
- 9993 Solid Lime St
- 579 Country Apple Ave
- 10003 Solid Lime St
- 9950 Rose Charmont St
- 570 Country Apple Ave
- 10030 Victorian Lace St
- 581 Morning Mauve Ave
- 618 Gritty Garnet Ave
- 569 Country Apple Ave