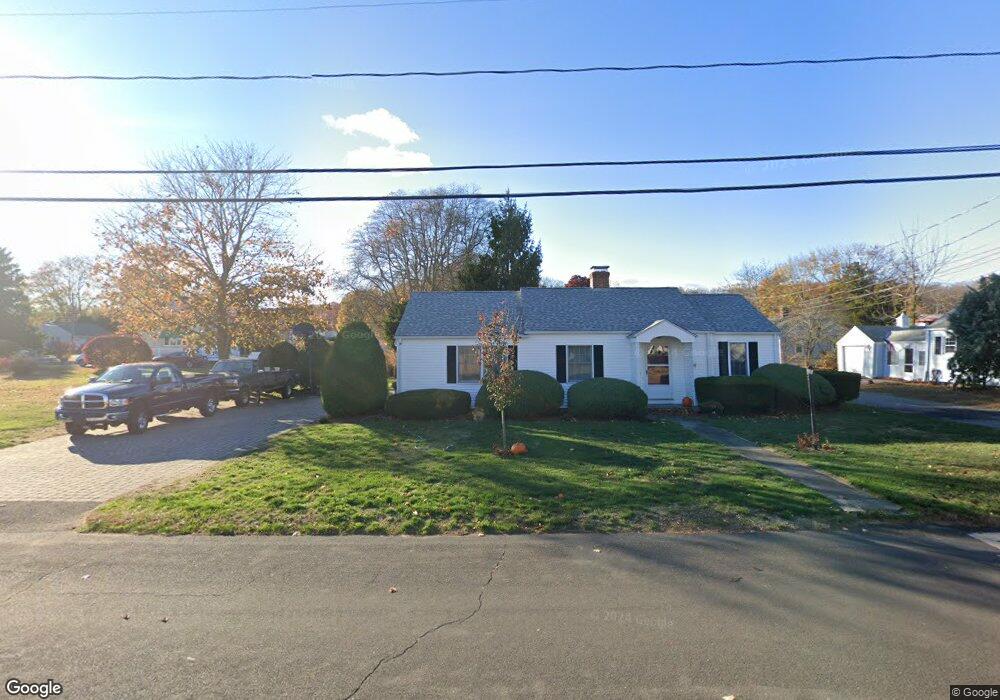
9A Huntley Ct Niantic, CT 06357
Estimated Value: $452,000 - $585,000
3
Beds
2
Baths
1,338
Sq Ft
$384/Sq Ft
Est. Value
About This Home
This home is located at 9A Huntley Ct, Niantic, CT 06357 and is currently estimated at $514,281, approximately $384 per square foot. 9A Huntley Ct is a home located in New London County with nearby schools including East Lyme Middle School, East Lyme High School, and The Light House Voc-Ed Center.
Ownership History
Date
Name
Owned For
Owner Type
Purchase Details
Closed on
Sep 15, 2006
Sold by
State Street Lending L
Bought by
Banas Sandra
Current Estimated Value
Home Financials for this Owner
Home Financials are based on the most recent Mortgage that was taken out on this home.
Original Mortgage
$120,000
Outstanding Balance
$71,395
Interest Rate
6.5%
Mortgage Type
Purchase Money Mortgage
Estimated Equity
$442,886
Create a Home Valuation Report for This Property
The Home Valuation Report is an in-depth analysis detailing your home's value as well as a comparison with similar homes in the area
Home Values in the Area
Average Home Value in this Area
Purchase History
| Date | Buyer | Sale Price | Title Company |
|---|---|---|---|
| Banas Sandra | $317,500 | -- | |
| Banas Sandra | $317,500 | -- |
Source: Public Records
Mortgage History
| Date | Status | Borrower | Loan Amount |
|---|---|---|---|
| Open | Banas Sandra | $120,000 | |
| Closed | Banas Sandra | $120,000 |
Source: Public Records
Tax History
| Year | Tax Paid | Tax Assessment Tax Assessment Total Assessment is a certain percentage of the fair market value that is determined by local assessors to be the total taxable value of land and additions on the property. | Land | Improvement |
|---|---|---|---|---|
| 2025 | $6,255 | $223,300 | $77,140 | $146,160 |
| 2024 | $5,884 | $223,300 | $77,140 | $146,160 |
| 2023 | $5,556 | $223,300 | $77,140 | $146,160 |
| 2022 | $5,323 | $223,300 | $77,140 | $146,160 |
| 2021 | $5,191 | $182,070 | $73,290 | $108,780 |
| 2020 | $5,144 | $181,370 | $73,290 | $108,080 |
| 2019 | $5,113 | $181,370 | $73,290 | $108,080 |
| 2018 | $4,960 | $181,370 | $73,290 | $108,080 |
| 2017 | $4,745 | $181,370 | $73,290 | $108,080 |
| 2016 | $4,656 | $183,610 | $69,440 | $114,170 |
| 2015 | $4,537 | $183,610 | $69,440 | $114,170 |
| 2014 | $4,412 | $183,610 | $69,440 | $114,170 |
Source: Public Records
Map
Nearby Homes
- 97 W Main St Unit 24
- 97 W Main St Unit 36
- 47 Village Crossing Unit 47
- 46 Village Crossing Unit 46
- 68-70 Black Point Rd
- 127 Black Point Rd Unit 7
- 19 Sapia Dr
- 43 Village Crossing Unit 43
- 55 Corey Ln
- 42 S Washington Ave
- 43 Roxbury Ct
- 468 Main St Unit 318
- 468 Main St Unit 111
- 9 Columbus Ave
- 18 Compass Ct
- 37 Stoneywood Dr
- 31 Regatta Dr
- 36 Attawan Rd
- 82 Roxbury Rd
- 80 Roxbury Rd
Your Personal Tour Guide
Ask me questions while you tour the home.