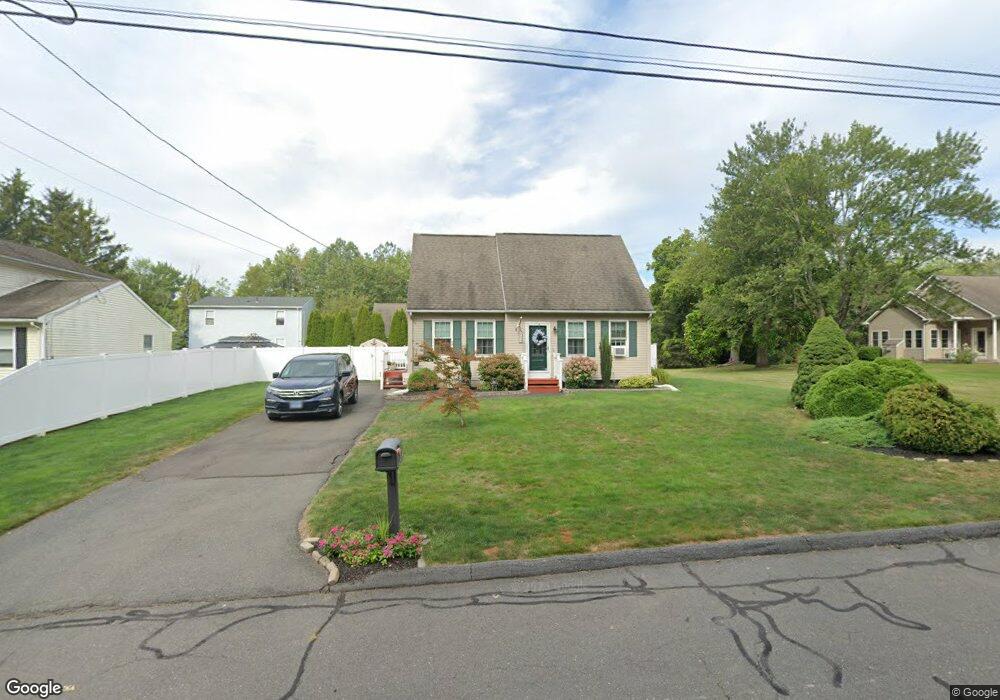
9B 2nd Ave Enfield, CT 06082
Estimated Value: $319,629 - $399,000
3
Beds
3
Baths
1,434
Sq Ft
$246/Sq Ft
Est. Value
About This Home
This home is located at 9B 2nd Ave, Enfield, CT 06082 and is currently estimated at $352,907, approximately $246 per square foot. 9B 2nd Ave is a home located in Hartford County with nearby schools including Prudence Crandall Elementary School, Henry Barnard Elementary School, and Enfield High School.
Ownership History
Date
Name
Owned For
Owner Type
Purchase Details
Closed on
Jun 27, 2008
Sold by
Benis Jeffrey and Benis Stacey
Bought by
Verrengia Bryan and Verrengia Maryellen
Current Estimated Value
Home Financials for this Owner
Home Financials are based on the most recent Mortgage that was taken out on this home.
Original Mortgage
$195,925
Outstanding Balance
$125,853
Interest Rate
6.07%
Mortgage Type
Purchase Money Mortgage
Estimated Equity
$227,054
Purchase Details
Closed on
Oct 29, 2001
Sold by
Sergeant John and Sergeant Sandr
Bought by
Benis Jeffrey
Home Financials for this Owner
Home Financials are based on the most recent Mortgage that was taken out on this home.
Original Mortgage
$124,053
Interest Rate
6.86%
Mortgage Type
Purchase Money Mortgage
Create a Home Valuation Report for This Property
The Home Valuation Report is an in-depth analysis detailing your home's value as well as a comparison with similar homes in the area
Home Values in the Area
Average Home Value in this Area
Purchase History
| Date | Buyer | Sale Price | Title Company |
|---|---|---|---|
| Verrengia Bryan | $199,000 | -- | |
| Benis Jeffrey | $126,000 | -- |
Source: Public Records
Mortgage History
| Date | Status | Borrower | Loan Amount |
|---|---|---|---|
| Open | Benis Jeffrey | $195,925 | |
| Previous Owner | Benis Jeffrey | $122,833 | |
| Previous Owner | Benis Jeffrey | $124,053 |
Source: Public Records
Tax History
| Year | Tax Paid | Tax Assessment Tax Assessment Total Assessment is a certain percentage of the fair market value that is determined by local assessors to be the total taxable value of land and additions on the property. | Land | Improvement |
|---|---|---|---|---|
| 2025 | $5,468 | $157,800 | $44,100 | $113,700 |
| 2024 | $5,335 | $157,800 | $44,100 | $113,700 |
| 2023 | $5,248 | $157,800 | $44,100 | $113,700 |
| 2022 | $4,827 | $157,800 | $44,100 | $113,700 |
| 2021 | $4,597 | $122,970 | $36,530 | $86,440 |
| 2020 | $4,597 | $122,970 | $36,530 | $86,440 |
| 2019 | $4,597 | $122,970 | $36,530 | $86,440 |
| 2018 | $4,495 | $122,970 | $36,530 | $86,440 |
| 2017 | $4,252 | $122,970 | $36,530 | $86,440 |
| 2016 | $4,113 | $120,940 | $36,530 | $84,410 |
| 2015 | $3,996 | $120,940 | $36,530 | $84,410 |
| 2014 | $3,904 | $120,940 | $36,530 | $84,410 |
Source: Public Records
Map
Nearby Homes
- 41 Field Rd
- 9 Eleanor Rd
- 73 Laurel St
- 9 Foxcroft Rd
- 9 Virginia Ave
- 23 Woodlawn Ave
- 15 Summer St
- 64 Hartford Ave
- 54 Hartford Ave
- 42 Hartford Ave
- 2 Sharren Ln
- 4 Marshall Dr
- 39 Union Street Extension
- 127 Windsor St
- 7 Pine Grove Ave
- 20 Manning Rd
- 148 Pleasant St
- 24 Ohear Ave
- 97 Pleasant St
- 30-32 Church St
Your Personal Tour Guide
Ask me questions while you tour the home.