


322 Lake St
Excelsior, MN 55331Highlights
- Waterfront
- Roof Terrace
- Deck
- Controlled Access
- Lake Access
- Walking/Biking Trails
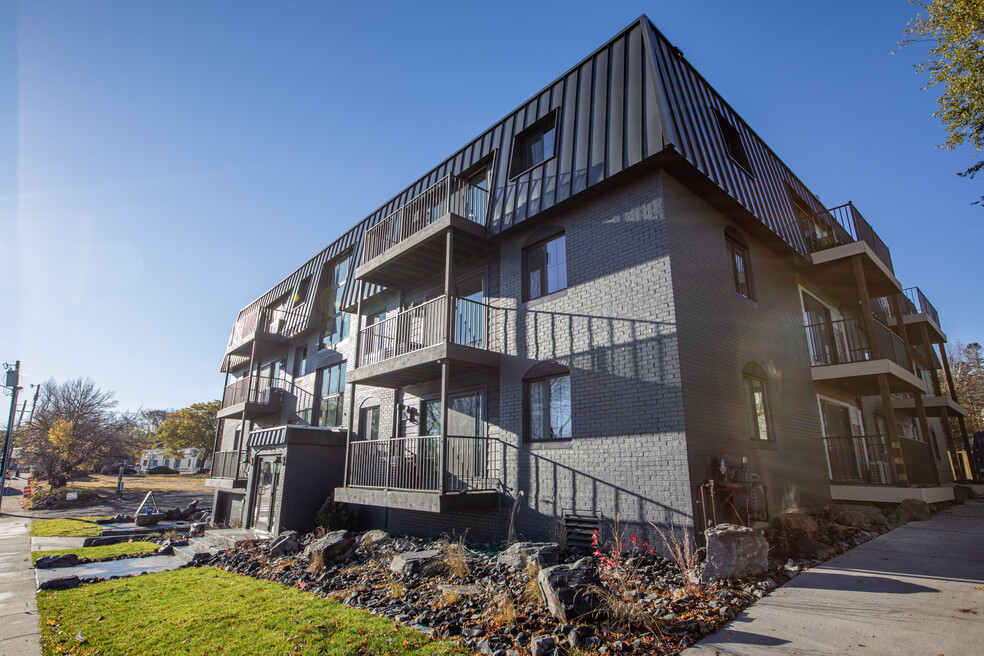
About Excelsior Shores
Welcome to Excelsior Shores, a vibrant apartment community nestled in the heart of downtown Excelsior, MN, right across from the stunning Lake Minnetonka. Here, urban charm beautifully meets natural beauty, creating a truly refined living experience for our residents.
Our thoughtfully designed apartments offer a perfect blend of style and comfort, featuring upscale finishes and modern amenities that cater to your every need. This is the ideal place for those who appreciate the finer things in life while enjoying a tranquil, connected lifestyle.
Step outside, and you’ll discover the charm of downtown Excelsior just waiting to be explored. Take leisurely strolls to unique boutiques, indulge in gourmet dining, or relax with a coffee in one of the inviting cafes—all within walking distance.
Commuting is also a breeze, with easy access to major highways and public transportation, making it simple to reach Minneapolis or embark on a weekend adventure.
At Excelsior Shores, you’ll find the perfect blend of sophistication and serenity. Come experience the welcoming community that embodies the best of downtown Excelsior living. Welcome home!

Pricing and Floor Plans
The total monthly price shown includes only the required fees. Additional fees may still apply to your rent. Use the rental calculator to estimate all potential associated costs.
1 Bedroom
The Gideon
$2,551 Total Monthly Price
1 Bed, 1 Bath, 805 Sq Ft
$1,000 deposit
https://imagescdn.homes.com/i2/wN5pQiGK4No0xbwmvUuEr2FykSZkIRn-UjeFROmftxw/116/excelsior-shores-excelsior-mn.jpg?p=1
| Unit | Price | Sq Ft | Availability |
|---|---|---|---|
| 206 | $2,469 | 805 | Apr 15 |
Fees and Policies
The fees below are based on community-supplied data and may exclude additional fees and utilities. Use the Rent Estimate Calculator to determine your monthly and one-time costs based on your requirements.
Utilities And Essentials
One-Time Basics
Due at ApplicationParking
Pets
Storage
Property Fee Disclaimer: Standard Security Deposit subject to change based on screening results; total security deposit(s) will not exceed any legal maximum. Resident may be responsible for maintaining insurance pursuant to the Lease. Some fees may not apply to apartment homes subject to an affordable program. Resident is responsible for damages that exceed ordinary wear and tear. Some items may be taxed under applicable law. This form does not modify the lease. Additional fees may apply in specific situations as detailed in the application and/or lease agreement, which can be requested prior to the application process. All fees are subject to the terms of the application and/or lease. Residents may be responsible for activating and maintaining utility services, including but not limited to electricity, water, gas, and internet, as specified in the lease agreement.
Community Amenities
Property Services
- Controlled Access
- Wi-Fi
Shared Community
- Elevator
Fitness & Recreation
- Walking/Biking Trails
- Bicycle Storage
Outdoor Features
- Waterfront
- Roof Terrace
- Lake Access
- Sundeck
Additional Amenities
- Community Use Paddleboards & Kayaks
- Downtown Excelsior
- In Unit Washer and Dryer
- Lake Minnetonka
- None
- Off Street Parking
- On Site Storage
- Private Decks
- RUBS
- Soft Close Cabinetry
- Stainless Steel Appliance Suite
- Sunrise Point Rooftop Deck
- Underground Heated Parking
- Walk In Tiled Showers
Apartment Features
Indoor Features
- Air Conditioning
- Washer/Dryer
- Heating
- High Speed Internet Access
- Sprinkler System
Kitchen Features & Appliances
- Dishwasher
- Disposal
- Microwave
- Kitchen
- Ice Maker
- Refrigerator
- Oven
- Stainless Steel Appliances
- Range
- Freezer
- Quartz Countertops
Model Details
- Hardwood Floors
- Views
- Carpet
- Deck
Matterport 3D Tours
Map
- 182 West Dr
- 9 West Dr
- 2 West Dr
- 312 3rd St
- 246 Morse Ave
- 834 3rd Ave
- 840-846 3rd Ave
- 5545 Shorewood Ln
- 5603 Manitou Rd
- 5540 Cr-19
- 5420 Mallard Ln
- 25200 Yellowstone Trail
- 19000 Stratford Rd
- 4831 Ridge Rd
- 740 W Village Rd Unit 104
- 19135 Highland Ave
- 7792 Village Place
- 19115 Homestead Cir
- 3465 Deephaven Ave
- 425 Chan View
Ask me questions while you tour the home.