Lot 40 Mariners Haven Rexford, MT 59930
Estimated Value: $140,996
--
Bed
--
Bath
--
Sq Ft
6,534
Sq Ft Lot
About This Home
This home is located at Lot 40 Mariners Haven, Rexford, MT 59930 and is currently estimated at $140,996. Lot 40 Mariners Haven is a home located in Lincoln County with nearby schools including Eureka Elementary School, Eureka Middle School, and Lincoln County High School.
Ownership History
Date
Name
Owned For
Owner Type
Purchase Details
Closed on
Aug 22, 2024
Sold by
Henke Virginia B
Bought by
Lees Jeffrey Thomas and Lees Larissa Dawn
Current Estimated Value
Purchase Details
Closed on
Dec 13, 2017
Sold by
Ntc & Co Virginia B Henke
Bought by
Henkke Virginia B
Purchase Details
Closed on
Jun 10, 2015
Sold by
Koocanusa Escapes Development Company Ll
Bought by
Earle Gary Paul and Earle Kristina Joan
Home Financials for this Owner
Home Financials are based on the most recent Mortgage that was taken out on this home.
Original Mortgage
$60,000
Interest Rate
3.64%
Mortgage Type
Purchase Money Mortgage
Purchase Details
Closed on
Jan 18, 2008
Sold by
Hammill Steve
Bought by
Ntc & Co Virginia B Henke Ira
Purchase Details
Closed on
Aug 16, 2006
Sold by
Mariners Haven Campground and Mariners Marina
Bought by
Hammill Steve
Create a Home Valuation Report for This Property
The Home Valuation Report is an in-depth analysis detailing your home's value as well as a comparison with similar homes in the area
Home Values in the Area
Average Home Value in this Area
Purchase History
| Date | Buyer | Sale Price | Title Company |
|---|---|---|---|
| Lees Jeffrey Thomas | -- | Flying S Title & Escrow | |
| Henkke Virginia B | -- | None Available | |
| Earle Gary Paul | -- | None Available | |
| Vickers James Gordon | -- | None Available | |
| Ntc & Co Virginia B Henke Ira | -- | Lincoln County Title Co | |
| Hammill Steve | -- | None Available |
Source: Public Records
Mortgage History
| Date | Status | Borrower | Loan Amount |
|---|---|---|---|
| Previous Owner | Vickers James Gordon | $60,000 | |
| Previous Owner | Earle Gary Paul | $80,000 |
Source: Public Records
Tax History Compared to Growth
Tax History
| Year | Tax Paid | Tax Assessment Tax Assessment Total Assessment is a certain percentage of the fair market value that is determined by local assessors to be the total taxable value of land and additions on the property. | Land | Improvement |
|---|---|---|---|---|
| 2025 | $264 | $102,690 | $0 | $0 |
| 2024 | $339 | $74,288 | $0 | $0 |
| 2023 | $436 | $74,288 | $0 | $0 |
| 2022 | $447 | $79,506 | $0 | $0 |
| 2021 | $479 | $79,506 | $0 | $0 |
| 2020 | $430 | $67,236 | $0 | $0 |
| 2019 | $429 | $67,236 | $0 | $0 |
| 2018 | $495 | $75,360 | $0 | $0 |
| 2017 | $472 | $75,360 | $0 | $0 |
| 2016 | $438 | $63,039 | $0 | $0 |
| 2015 | $356 | $63,039 | $0 | $0 |
| 2014 | $188 | $16,806 | $0 | $0 |
Source: Public Records
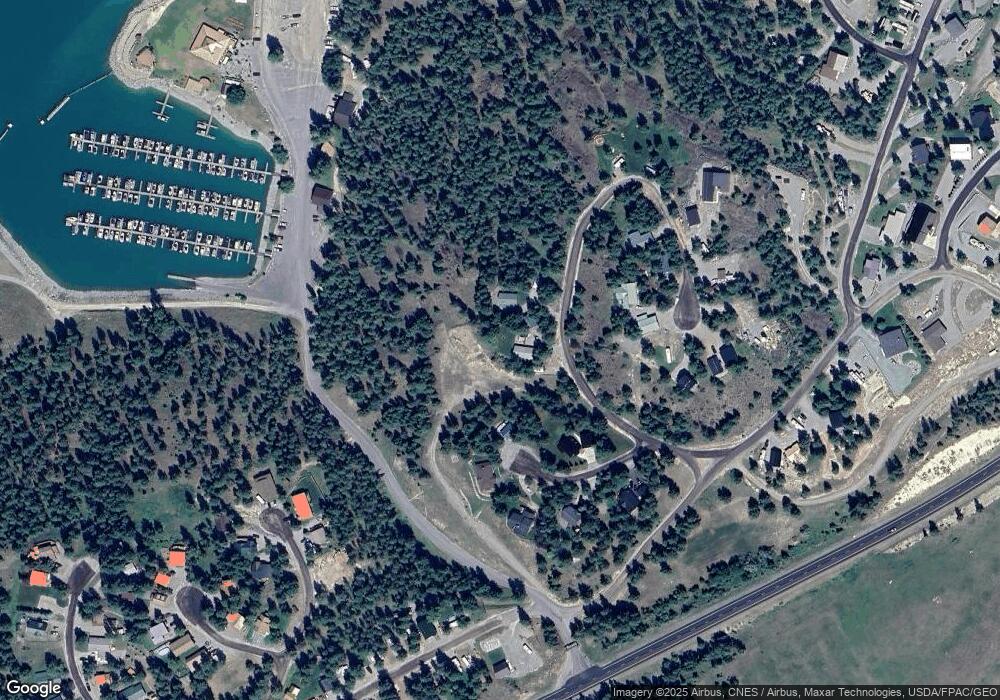
Map
Nearby Homes
- 95 Reservoir Ct
- 399 Kokanee Dr
- 99 Osprey Ct
- 50 Skyview Dr
- 80 Lake Ct
- 120 Lodge Rd
- 206 Kokanee Dr E
- 59217 Montana 37
- 245 Kokanee Dr E
- 93 Nelson Dr
- 99 Nelson Dr
- Lot 2 Elk View Estates
- Lot 3 Elk View
- 1 Elk View Estates
- 118 Salmon Dr
- Lot 1 Elk Camp
- Nhn Paradise Ridge Rd
- 272 Gateway St
- 209 Solitude Ln
- 747 Grand View Dr
- 204 Kokanee Dr
- 192 Kokanee Dr
- 90 Reservoir Ct
- 92 Reservoir Ct
- 48 Reservoir Ct
- 98 Reservoir Ct
- 27 Reservoir Ct
- NHN Reservoir Ct
- 47 Reservoir Ct
- 53 Reservoir Ct
- 54 Reservoir Ct
- 52 Reservoir Ct
- 35 & 25 Skippers Ct
- 25 Skippers Ct
- 99 Reservoir Ct
- Lot 1 Kokanee Dr
- 43 Skippers Ct
- 35 Skippers Ct
- 120 Reservoir Ct
- 108 Kokanee Dr