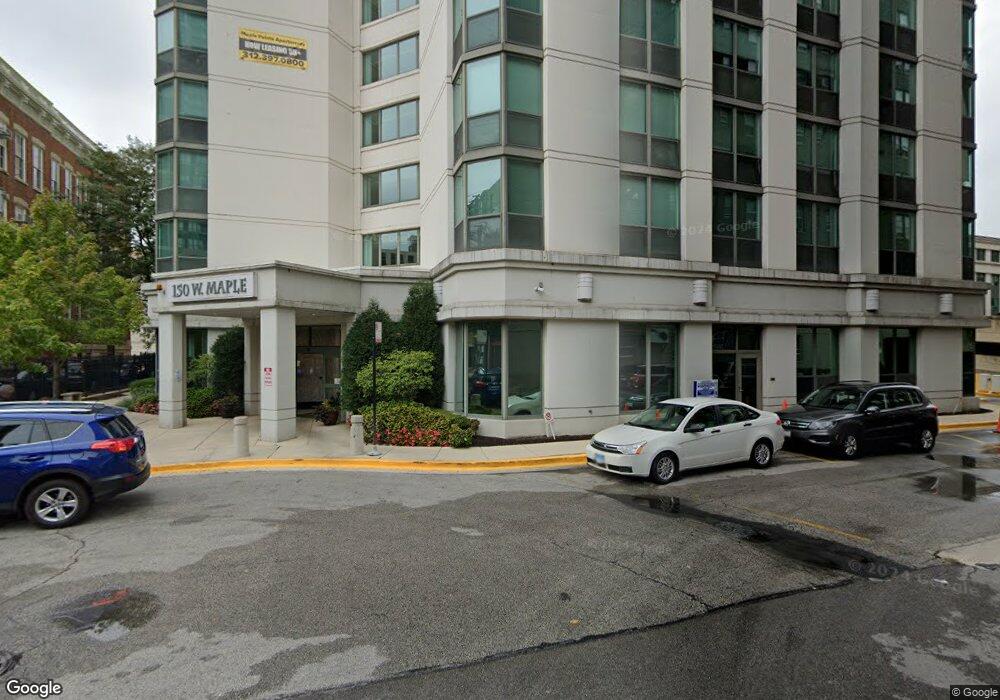
150 W Maple St Chicago, IL 60610
River North Neighborhood
1
Bed
--
Bath
540
Sq Ft
0.42
Acres
About This Home
Our waitlist is open for both HUD and Tax Credit Units. Families must meet certain eligibility requirements. Please contact leasing office for more information.
Nestled in the heart of Chicago, Maple Pointe offers all the rewards and comforts of high-class living. Whether it be a relaxing night of beautiful Chicago views or a night out on the town, Maple Pointe gives you the neighborhood you’re looking for at the price you want.
We offer pet-friendly, 1-bedroom floor plans just minutes from Chicago's finest shopping and dining, you get the benefits of city living, combined with comforting amenities.
Ownership History
Date
Name
Owned For
Owner Type
Purchase Details
Closed on
Oct 18, 2004
Sold by
Lasalle Bank Na
Bought by
Hill Street Associates Lp
Home Financials for this Owner
Home Financials are based on the most recent Mortgage that was taken out on this home.
Original Mortgage
$14,250,000
Interest Rate
5.91%
Mortgage Type
Commercial
Purchase Details
Closed on
Dec 11, 1992
Sold by
Lake Shore National Bank
Bought by
Lake Shore National Bank
Create a Home Valuation Report for This Property
The Home Valuation Report is an in-depth analysis detailing your home's value as well as a comparison with similar homes in the area
Home Values in the Area
Average Home Value in this Area
Purchase History
| Date | Buyer | Sale Price | Title Company |
|---|---|---|---|
| Hill Street Associates Lp | -- | Near North National Title Co | |
| Lake Shore National Bank | -- | -- |
Source: Public Records
Mortgage History
| Date | Status | Borrower | Loan Amount |
|---|---|---|---|
| Closed | Hill Street Associates Lp | $14,250,000 |
Source: Public Records
Property History
| Date | Event | Price | List to Sale | Price per Sq Ft |
|---|---|---|---|---|
| 10/04/2025 10/04/25 | Off Market | $1,230 | -- | -- |
| 09/02/2025 09/02/25 | Price Changed | $1,230 | 0.0% | $2 / Sq Ft |
| 08/15/2025 08/15/25 | Price Changed | $1,230 | 0.0% | $2 / Sq Ft |
| 08/05/2025 08/05/25 | Price Changed | $1,230 | -6.3% | $2 / Sq Ft |
| 07/11/2025 07/11/25 | Price Changed | $1,313 | -34.4% | $2 / Sq Ft |
| 07/04/2025 07/04/25 | Price Changed | $2,000 | +62.6% | $4 / Sq Ft |
| 07/02/2025 07/02/25 | Price Changed | $1,230 | -38.5% | $2 / Sq Ft |
| 06/26/2025 06/26/25 | Price Changed | $2,000 | +62.6% | $4 / Sq Ft |
| 06/20/2025 06/20/25 | Price Changed | $1,230 | 0.0% | $2 / Sq Ft |
| 06/16/2025 06/16/25 | Price Changed | $1,230 | +20.6% | $2 / Sq Ft |
| 06/16/2025 06/16/25 | For Rent | -- | -- | -- |
| 12/04/2024 12/04/24 | Off Market | $1,020 | -- | -- |
| 11/27/2024 11/27/24 | Price Changed | $1,020 | -15.7% | $2 / Sq Ft |
| 09/03/2024 09/03/24 | For Rent | $1,210 | 0.0% | -- |
| 09/28/2023 09/28/23 | Price Changed | $1,210 | -36.0% | $2 / Sq Ft |
| 09/09/2023 09/09/23 | Price Changed | $1,891 | +56.3% | $4 / Sq Ft |
| 08/30/2023 08/30/23 | Price Changed | $1,210 | 0.0% | $2 / Sq Ft |
| 08/10/2023 08/10/23 | Price Changed | $1,210 | -36.0% | $2 / Sq Ft |
| 08/07/2023 08/07/23 | For Rent | $1,891 | 0.0% | -- |
| 07/29/2023 07/29/23 | Price Changed | $1,891 | -8.3% | $4 / Sq Ft |
| 07/28/2023 07/28/23 | Price Changed | $2,062 | 0.0% | $4 / Sq Ft |
| 07/22/2023 07/22/23 | For Rent | $2,062 | -- | -- |
Tax History Compared to Growth
Tax History
| Year | Tax Paid | Tax Assessment Tax Assessment Total Assessment is a certain percentage of the fair market value that is determined by local assessors to be the total taxable value of land and additions on the property. | Land | Improvement |
|---|---|---|---|---|
| 2024 | $264,606 | $1,342,001 | $370,853 | $971,148 |
| 2023 | $257,949 | $1,254,113 | $238,875 | $1,015,238 |
| 2022 | $257,949 | $1,254,113 | $238,875 | $1,015,238 |
| 2021 | $387,986 | $1,929,405 | $367,500 | $1,561,905 |
| 2020 | $219,744 | $986,420 | $367,500 | $618,920 |
| 2019 | $198,184 | $986,420 | $367,500 | $618,920 |
| 2018 | $194,851 | $986,420 | $367,500 | $618,920 |
| 2017 | $182,804 | $849,188 | $183,750 | $665,438 |
| 2016 | $170,083 | $849,188 | $183,750 | $665,438 |
| 2015 | $155,610 | $849,188 | $183,750 | $665,438 |
| 2014 | $157,662 | $849,756 | $137,812 | $711,944 |
| 2013 | $154,549 | $849,756 | $137,812 | $711,944 |
Source: Public Records
Map
Nearby Homes
- 111 W Maple St Unit 2803
- 111 W Maple St Unit 1805
- 111 W Maple St Unit 2601
- 1160 N Lasalle St
- 1122 N Clark St Unit 1808
- 1122 N Clark St Unit 1403
- 1122 N Clark St Unit 2202
- 1122 N Clark St Unit P349
- 1122 N Clark St Unit 3301-10
- 111 W Elm St
- 1212 N La Salle Dr Unit 344
- 1212 N La Salle Dr Unit 2303
- 1212 N La Salle Dr Unit 316
- 1212 N La Salle Dr Unit 309
- 1212 N La Salle Dr Unit 313
- 230 W Division St Unit 1202
- 1122 N Dearborn St Unit 18I
- 1122 N Dearborn St Unit 25H
- 1112 N Dearborn St Unit 1
- 1255 N Sandburg Terrace Unit 1707E
- 150 W Maple St
- 150 W Maple St
- 1101 N Wells St Unit 3
- 1101 N Wells St
- 201 W Hill St Unit 4
- 201 W Hill St Unit 3607
- 201 W Hill St
- 203 W Hill St
- 103 W Hill St
- 207 W Hill St
- 197 W Hill St
- 199 W Hill St
- 205 W Hill St Unit 2411
- 300 W Hill St
- 300 W Hill St
- 300 W Hill St
- 300 W Hill St Unit 2204
- 300 W Hill St Unit 903
- 300 W Hill St Unit 804
- 300 W Hill St Unit 802