
Seller's Agent in 2021
Jerry Harkness
Keller Williams Lanier Partners
(706) 949-3747
42 in this area
259 Total Sales
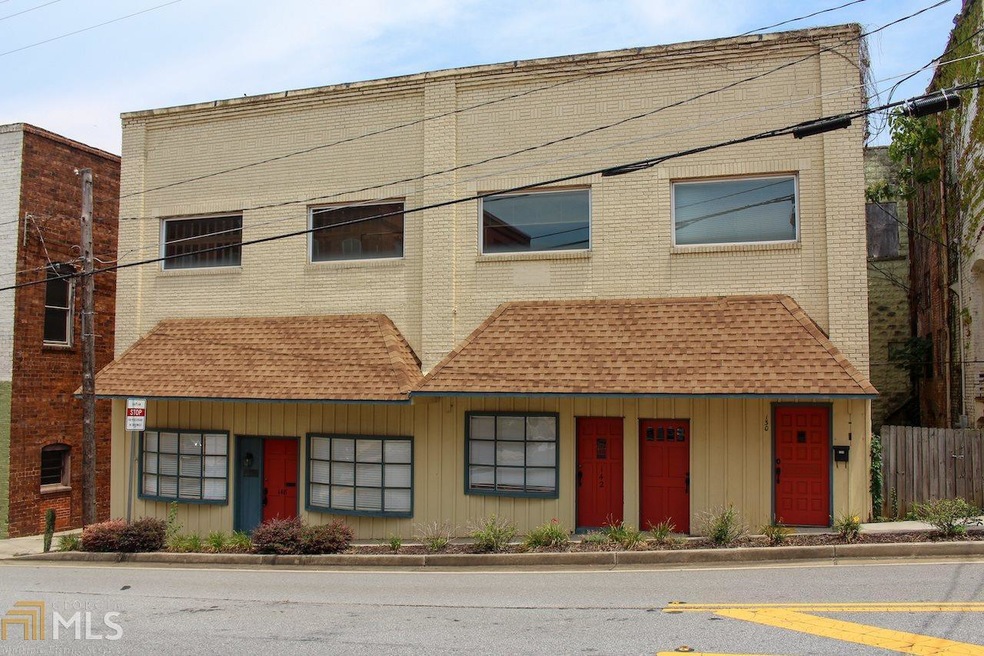
Located in Downtown Cornelia in the Central Business District, this property has nearly 6,000 sqft of usable space. Over 7,000 cars per day travel past the property per a GADOT traffic count. This property has four main level entry doors, and a back door leading to a parking lot in the rear of the building.
Last Agent to Sell the Property
Keller Williams Lanier Partners License #367943 Listed on: 07/31/2020
Last Buyer's Agent
Keller Williams Lanier Partners License #367943 Listed on: 07/31/2020
| Date | Event | Price | List to Sale | Price per Sq Ft | Prior Sale |
|---|---|---|---|---|---|
| 05/28/2021 05/28/21 | Sold | $160,000 | -11.1% | $29 / Sq Ft | |
| 04/18/2021 04/18/21 | Pending | -- | -- | -- | |
| 02/22/2021 02/22/21 | Price Changed | $180,000 | -9.5% | $33 / Sq Ft | |
| 07/31/2020 07/31/20 | For Sale | $199,000 | +13.7% | $37 / Sq Ft | |
| 01/22/2020 01/22/20 | Sold | $175,000 | -12.1% | $23 / Sq Ft | View Prior Sale |
| 12/31/2019 12/31/19 | Pending | -- | -- | -- | |
| 08/02/2019 08/02/19 | For Sale | $199,000 | +121.1% | $26 / Sq Ft | |
| 12/23/2015 12/23/15 | Sold | $90,000 | -40.0% | $5 / Sq Ft | View Prior Sale |
| 12/22/2015 12/22/15 | Pending | -- | -- | -- | |
| 07/30/2015 07/30/15 | Sold | $150,000 | +500.0% | $5 / Sq Ft | View Prior Sale |
| 07/22/2015 07/22/15 | Sold | $25,000 | -92.6% | $5 / Sq Ft | View Prior Sale |
| 07/22/2015 07/22/15 | Pending | -- | -- | -- | |
| 06/09/2015 06/09/15 | For Sale | $339,000 | +384.3% | $18 / Sq Ft | |
| 06/09/2015 06/09/15 | Pending | -- | -- | -- | |
| 12/11/2014 12/11/14 | For Sale | $70,000 | -93.5% | $15 / Sq Ft | |
| 01/20/2014 01/20/14 | For Sale | $1,070,000 | -- | $37 / Sq Ft |
Seller's Agent in 2021
Jerry Harkness
Keller Williams Lanier Partners
(706) 949-3747
42 in this area
259 Total Sales
Buyer's Agent in 2020
Alice Dover
Headwaters Realty
(706) 968-3518
10 in this area
49 Total Sales
B
Seller's Agent in 2015
Bob Wollaston
Chapman Hall Realtors
Seller's Agent in 2015
Jana Flury
Keller Williams Lanier Partners
(706) 499-6896
3 in this area
44 Total Sales
S
Seller Co-Listing Agent in 2015
Susan Strickland
Chapman Hall Realtors
G
Buyer's Agent in 2015
Greg Guthrie
Century 21 Community Realty
Source: Georgia MLS
MLS Number: 8831705
Disclaimer: Certain information contained herein is derived from information provided by parties other than Homes.com. All information provided is deemed reliable, but is not guaranteed to be accurate and should be independently verified.
![]() The data relating to real estate for sale on this web site comes in part from the Broker Reciprocity Program of Georgia MLS. Real estate listings held by brokerage firms other than Redfin are marked with the Broker Reciprocity logo and detailed information about them includes the name of the listing brokers. Information deemed reliable but not guaranteed. Copyright 2026 Georgia MLS. All rights reserved.
The data relating to real estate for sale on this web site comes in part from the Broker Reciprocity Program of Georgia MLS. Real estate listings held by brokerage firms other than Redfin are marked with the Broker Reciprocity logo and detailed information about them includes the name of the listing brokers. Information deemed reliable but not guaranteed. Copyright 2026 Georgia MLS. All rights reserved.