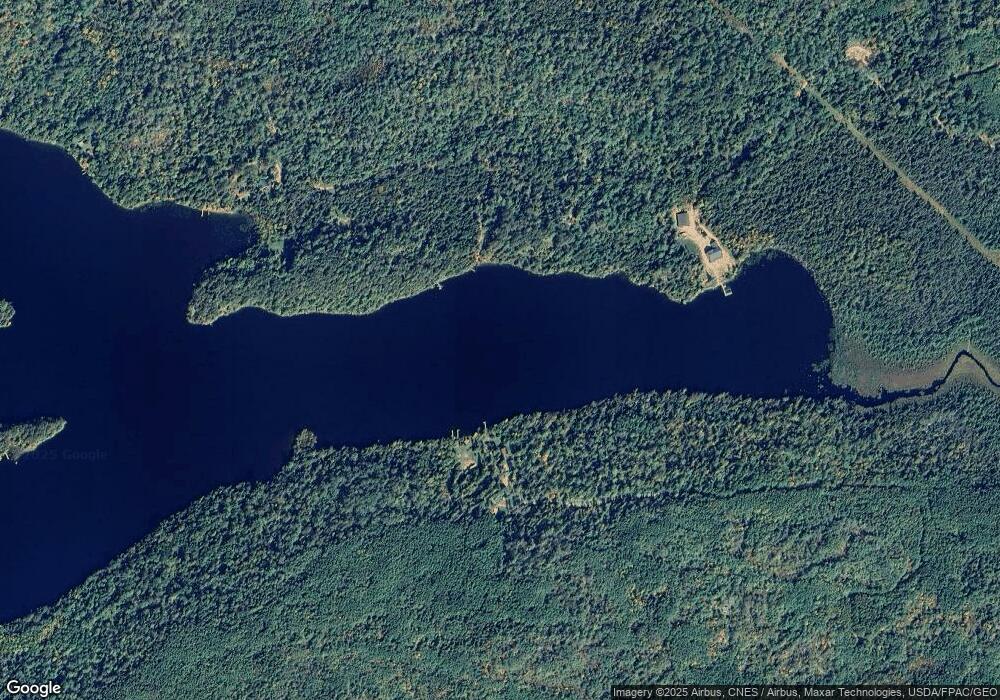
TBD Mud Creek Bay Breitung Township, MN 55790
--
Bed
--
Bath
--
Sq Ft
4.13
Acres
About This Home
This home is located at TBD Mud Creek Bay, Breitung Township, MN 55790. TBD Mud Creek Bay is a home located in St. Louis County with nearby schools including Tower-Soudan Elementary School.
Ownership History
Date
Name
Owned For
Owner Type
Purchase Details
Closed on
Sep 12, 2019
Sold by
Fossum Roger W and Fossum Christine M
Bought by
Stilwell Brian
Home Financials for this Owner
Home Financials are based on the most recent Mortgage that was taken out on this home.
Original Mortgage
$58,720
Interest Rate
3.7%
Mortgage Type
Commercial
Purchase Details
Closed on
Sep 16, 2009
Sold by
Jenkins Dennis and Jenkins Lorie
Bought by
Fossum Roger W and Fossum Christine M
Purchase Details
Closed on
Oct 12, 2004
Sold by
Ericsson Dwight V and Ericsson Ann E
Bought by
Jenkins Dennis and Jenkins Lorie
Create a Home Valuation Report for This Property
The Home Valuation Report is an in-depth analysis detailing your home's value as well as a comparison with similar homes in the area
Home Values in the Area
Average Home Value in this Area
Purchase History
| Date | Buyer | Sale Price | Title Company |
|---|---|---|---|
| Stilwell Brian | $85,900 | North Eastern Title Company | |
| Fossum Roger W | $154,900 | Rels | |
| Jenkins Dennis | $147,251 | Ati |
Source: Public Records
Mortgage History
| Date | Status | Borrower | Loan Amount |
|---|---|---|---|
| Closed | Stilwell Brian | $58,720 |
Source: Public Records
Tax History Compared to Growth
Tax History
| Year | Tax Paid | Tax Assessment Tax Assessment Total Assessment is a certain percentage of the fair market value that is determined by local assessors to be the total taxable value of land and additions on the property. | Land | Improvement |
|---|---|---|---|---|
| 2024 | $552 | $54,100 | $54,100 | $0 |
| 2023 | $552 | $51,600 | $51,600 | $0 |
| 2022 | $608 | $51,600 | $51,600 | $0 |
| 2021 | $1,188 | $49,200 | $49,200 | $0 |
| 2020 | $1,380 | $98,800 | $98,800 | $0 |
| 2019 | $1,334 | $112,100 | $112,100 | $0 |
| 2018 | $1,286 | $112,600 | $112,600 | $0 |
| 2017 | $1,322 | $106,600 | $106,600 | $0 |
| 2016 | $1,334 | $106,600 | $106,600 | $0 |
| 2015 | $1,414 | $95,400 | $95,400 | $0 |
| 2014 | $1,414 | $104,900 | $104,900 | $0 |
Source: Public Records
Map
Nearby Homes