Estimated payment $15,305/month
About This Home
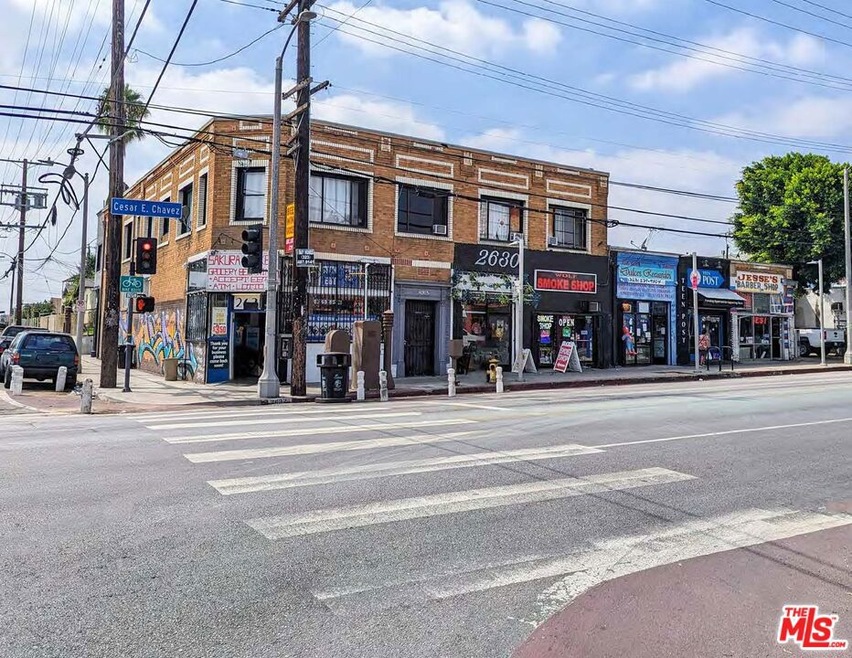
2626 East Cesar Chavez Avenue presents a compelling investment opportunity in the Boyle Heights market. This well-managed, 100% leased asset offers a competitive 6.67% cap rate. Located on a corner lot at a signalized intersection with prime visibility, the property is situated in a rapidly gentrifying area with growing demographics, positioning it for future growth.
Property Details
Home Type
- Multi-Family
Est. Annual Taxes
- $19,685
Year Built
- Built in 1925
Lot Details
- 8,986 Sq Ft Lot
- Lot Dimensions are 90x100
Home Design
- Split Level Home
Interior Spaces
- 10,758 Sq Ft Home
- 2-Story Property
Community Details
- 7 Units
Listing and Financial Details
- Assessor Parcel Number 5180-009-006
Home Values in the Area
Average Home Value in this Area
Tax History
| Year | Tax Paid | Tax Assessment Tax Assessment Total Assessment is a certain percentage of the fair market value that is determined by local assessors to be the total taxable value of land and additions on the property. | Land | Improvement |
|---|---|---|---|---|
| 2025 | $19,685 | $1,556,507 | $656,753 | $899,754 |
| 2024 | $19,685 | $1,525,988 | $643,876 | $882,112 |
| 2023 | $19,321 | $1,496,067 | $631,251 | $864,816 |
| 2022 | $18,457 | $1,466,733 | $618,874 | $847,859 |
| 2021 | $18,179 | $1,437,975 | $606,740 | $831,235 |
| 2020 | $18,348 | $1,423,231 | $600,519 | $822,712 |
| 2019 | $17,653 | $1,395,326 | $588,745 | $806,581 |
| 2018 | $17,204 | $1,367,967 | $577,201 | $790,766 |
| 2016 | $16,408 | $1,314,849 | $554,789 | $760,060 |
| 2015 | $16,174 | $1,295,100 | $546,456 | $748,644 |
| 2014 | $16,237 | $1,269,732 | $535,752 | $733,980 |
Property History
| Date | Event | Price | List to Sale | Price per Sq Ft |
|---|---|---|---|---|
| 02/11/2025 02/11/25 | For Sale | $2,575,000 | -- | $239 / Sq Ft |
Purchase History
| Date | Type | Sale Price | Title Company |
|---|---|---|---|
| Grant Deed | -- | Orange Coast Title | |
| Grant Deed | -- | American Title | |
| Grant Deed | $3,000 | -- | |
| Trustee Deed | $169,955 | -- |
Source: The MLS
MLS Number: 25497187
APN: 5180-009-006
Disclaimer: Certain information contained herein is derived from information provided by parties other than Homes.com. All information provided is deemed reliable, but is not guaranteed to be accurate and should be independently verified.
![]() © 2025 The MLS™ - Combined L.A. Westside MLS (CLAW). All rights reserved. Based on information from The MLS™ - Combined L.A. Westside MLS (CLAW). All data, including all measurements and calculations of area, is obtained from various sources and has not been, and will not be, verified by broker or MLS. All information should be independently reviewed and verified for accuracy. Properties may or may not be listed by the office/agent presenting the information.
© 2025 The MLS™ - Combined L.A. Westside MLS (CLAW). All rights reserved. Based on information from The MLS™ - Combined L.A. Westside MLS (CLAW). All data, including all measurements and calculations of area, is obtained from various sources and has not been, and will not be, verified by broker or MLS. All information should be independently reviewed and verified for accuracy. Properties may or may not be listed by the office/agent presenting the information.
IDX information is provided exclusively for personal, non-commercial use, and may not be used for any purpose other than to identify prospective properties consumers may be interested in purchasing.
Information is deemed reliable but not guaranteed.
- 422 N Mott St
- 2719 Cincinnati St
- 2607 Pennsylvania Ave
- 2719 Folsom St
- 2750 Folsom St
- 2743 Boulder St
- 2809 Folsom St
- 2522 E 1st St
- 2750 Malabar St
- 2516 Malabar St
- 2415 Boulder St
- 113 S Mathews St
- 2618 Gleason Ave
- 223 N Breed St
- 701 N Fickett St
- 2437 Malabar St
- 2221 Michigan Ave
- 2737 Winter St
- 244 N Chicago St
- 2626 E 2nd St
- 2527 Cincinnati St Unit 5
- 2614 Michigan Ave Unit 4
- 2607 Pennsylvania Ave
- 2745 Folsom St
- 126 N Saratoga St
- 402 N Soto St
- 2448 Boulder St Unit 10
- 2718 Malabar St Unit A
- 2718 Malabar St
- 2855 Cincinnati St Unit 1
- 2855 1/2 Cincinnati St Unit 3
- 2447 Malabar St
- 2341 Sheridan St
- 2341 Sheridan St Unit Sherdian
- 3040 Boulder St
- 2816 E 3rd St
- 2740 Wabash Ave
- 2742 Wabash Ave
- 2635 Dobinson St Unit B
- 2639 Dobinson St Unit B
