V
Seller's Agent in 2025
Valerie Tillery
Mars Hill Realty
(512) 942-0024
3 Total Sales
Estimated Value: $189,000 - $339,000
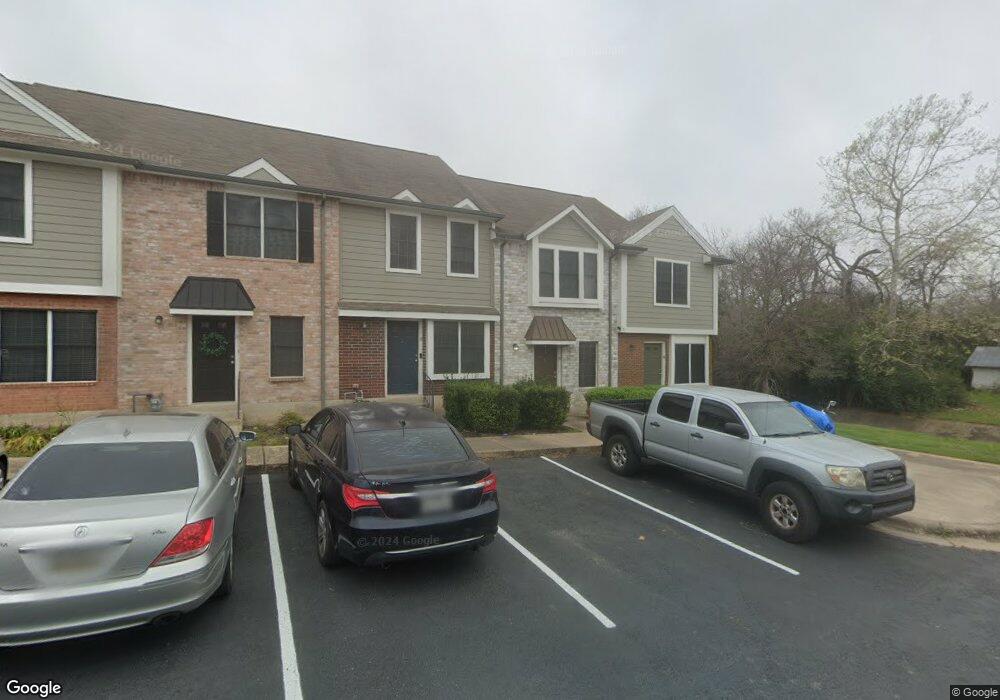
Urban 2bed/2bath townhome is centrally located between San Gabriel Park and Southwestern University. Back patio is the perfect place to grill and relax. Unit comes equipped with refrigerator, washer and dryer. Enjoy fine dining, good shopping and a host of special activities at historic Georgetown Square. Nearby jogging trails and sports park make it easy to stay active. Walking distance to San Gabriel Park; only minutes from Blue Hole, Wolf Ranch Shopping Center and IH35. One pet only; limit 35 lbs. **Residents must choose between two resident benefit packages at time of application. (Photos taken in Unit 7; video of Unit 3. Finishes may vary.)
| Date | Event | Price | List to Sale | Price per Sq Ft |
|---|---|---|---|---|
| 11/04/2025 11/04/25 | Rented | $1,300 | 0.0% | -- |
| 10/30/2025 10/30/25 | Under Contract | -- | -- | -- |
| 10/27/2025 10/27/25 | Price Changed | $1,300 | 0.0% | $1 / Sq Ft |
| 10/02/2025 10/02/25 | For Rent | $1,300 | -10.3% | -- |
| 09/24/2025 09/24/25 | For Rent | $1,450 | 0.0% | -- |
| 06/23/2021 06/23/21 | Rented | $1,450 | 0.0% | -- |
| 06/16/2021 06/16/21 | Under Contract | -- | -- | -- |
| 06/01/2021 06/01/21 | For Rent | $1,450 | +13.7% | -- |
| 05/04/2020 05/04/20 | Rented | $1,275 | 0.0% | -- |
| 04/27/2020 04/27/20 | Under Contract | -- | -- | -- |
| 04/02/2020 04/02/20 | For Rent | $1,275 | +2.0% | -- |
| 04/30/2019 04/30/19 | Rented | $1,250 | 0.0% | -- |
| 04/29/2019 04/29/19 | Under Contract | -- | -- | -- |
| 03/01/2019 03/01/19 | For Rent | $1,250 | +4.2% | -- |
| 06/28/2016 06/28/16 | Rented | $1,200 | 0.0% | -- |
| 06/23/2016 06/23/16 | Under Contract | -- | -- | -- |
| 06/07/2016 06/07/16 | For Rent | $1,200 | +20.0% | -- |
| 07/13/2015 07/13/15 | Rented | $1,000 | 0.0% | -- |
| 07/06/2015 07/06/15 | Under Contract | -- | -- | -- |
| 06/19/2015 06/19/15 | For Rent | $1,000 | -- | -- |
| Year | Tax Paid | Tax Assessment Tax Assessment Total Assessment is a certain percentage of the fair market value that is determined by local assessors to be the total taxable value of land and additions on the property. | Land | Improvement |
|---|---|---|---|---|
| 2025 | $3,465 | $187,506 | $21,000 | $166,506 |
| 2024 | $3,465 | $190,489 | $21,000 | $169,489 |
| 2023 | $3,456 | $192,188 | $21,000 | $171,188 |
| 2022 | $2,595 | $132,175 | $21,000 | $111,175 |
| 2021 | $2,130 | $97,518 | $15,900 | $81,618 |
| 2020 | $1,900 | $85,682 | $15,144 | $70,538 |
| 2019 | $1,863 | $81,416 | $15,900 | $65,516 |
| 2018 | $1,679 | $73,361 | $8,025 | $65,336 |
| 2017 | $1,537 | $66,553 | $7,500 | $59,053 |
| 2016 | $1,270 | $54,979 | $7,500 | $47,479 |
| 2015 | $994 | $45,047 | $5,000 | $40,047 |
| 2014 | $994 | $42,886 | $0 | $0 |
V
Seller's Agent in 2025
Valerie Tillery
Mars Hill Realty
(512) 942-0024
3 Total Sales
E
Seller's Agent in 2025
Edward Lui
Mars Hill Realty
(512) 942-0024
6 Total Sales
D
Buyer's Agent in 2025
Deliesha Clark
JBGoodwin REALTORS WC
(512) 826-2265
6 Total Sales

Buyer's Agent in 2021
Gloria Walls
Coldwell Banker Realty
(512) 422-4598
91 Total Sales
N
Buyer's Agent in 2020
Non Member
Non Member
Buyer's Agent in 2019
Helen Brown
Coldwell Banker Realty
(346) 218-6882
18 Total Sales