Estimated Value: $100,989 - $265,000
3.7
Acres
$43,175
Price per Acre
161,172
Sq Ft Lot
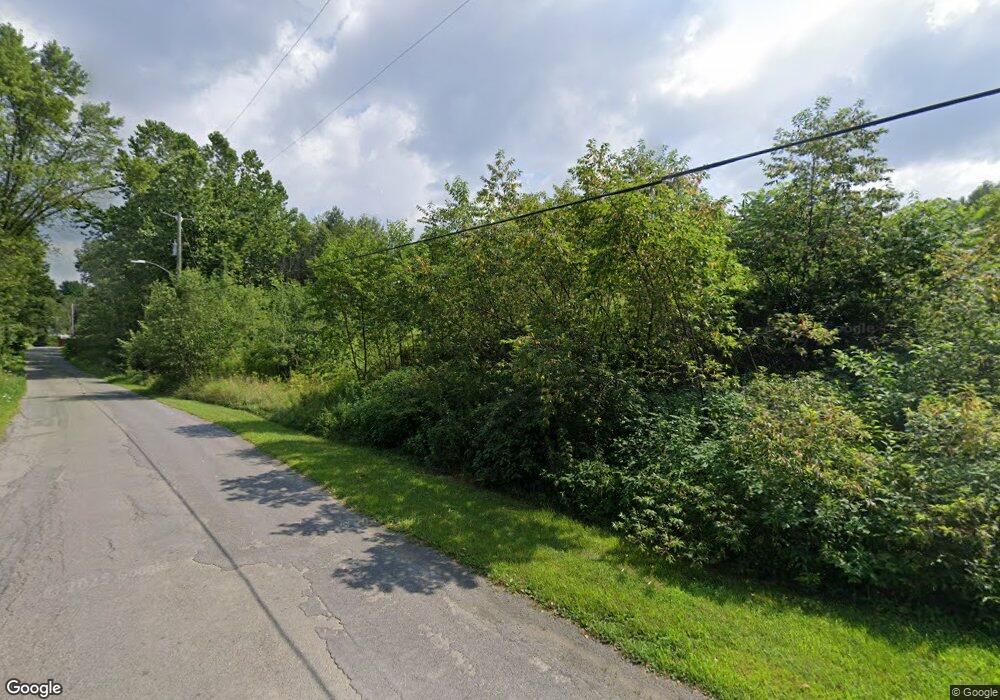
About This Lot
As of May 2017Large piece of land on rural road. Land slopes up from road to level area where buildings could be built. Lots of frontage and just a mile or two from schools, stores and other points of interest.
Property Details
Property Type
- Land
Est. Annual Taxes
- $376
Lot Details
- 3.7 Acre Lot
- Terraced Lot
- Property is zoned Agr, Agr
Schools
- Olmsted Elementary School
Additional Features
- Pasture
- Cable TV Available
Ownership History
Date
Name
Owned For
Owner Type
Purchase Details
Listed on
Jun 27, 2016
Closed on
Apr 13, 2017
Sold by
Carpenter William A
Bought by
Moore Kevin and Moore Billie Jo
List Price
$11,000
Sold Price
$10,000
Premium/Discount to List
-$1,000
-9.09%
Current Estimated Value
Home Financials for this Owner
Home Financials are based on the most recent Mortgage that was taken out on this home.
Estimated Appreciation
$149,747
Avg. Annual Appreciation
38.81%
Create a Home Valuation Report for This Property
The Home Valuation Report is an in-depth analysis detailing your home's value as well as a comparison with similar homes in the area
Home Values in the Area
Average Home Value in this Area
Purchase History
| Date | Buyer | Sale Price | Title Company |
|---|---|---|---|
| Moore Kevin | $10,000 | None Available |
Source: Public Records
Property History
| Date | Event | Price | List to Sale | Price per Sq Ft |
|---|---|---|---|---|
| 05/01/2017 05/01/17 | Sold | $10,000 | -9.1% | -- |
| 02/20/2017 02/20/17 | Pending | -- | -- | -- |
| 06/27/2016 06/27/16 | For Sale | $11,000 | -- | -- |
Source: Greater Binghamton Association of REALTORS®
Tax History Compared to Growth
Tax History
| Year | Tax Paid | Tax Assessment Tax Assessment Total Assessment is a certain percentage of the fair market value that is determined by local assessors to be the total taxable value of land and additions on the property. | Land | Improvement |
|---|---|---|---|---|
| 2024 | $1,204 | $3,125 | $1,135 | $1,990 |
| 2023 | $1,188 | $3,125 | $1,135 | $1,990 |
| 2022 | $1,145 | $3,125 | $1,135 | $1,990 |
| 2021 | $1,132 | $3,125 | $1,135 | $1,990 |
| 2020 | $1,139 | $3,125 | $1,135 | $1,990 |
| 2019 | -- | $3,125 | $1,135 | $1,990 |
| 2018 | $1,080 | $3,125 | $1,135 | $1,990 |
| 2017 | $383 | $1,135 | $1,135 | $0 |
| 2016 | $382 | $1,135 | $1,135 | $0 |
| 2015 | -- | $1,135 | $1,135 | $0 |
| 2014 | -- | $1,135 | $1,135 | $0 |
Source: Public Records
Source: Greater Binghamton Association of REALTORS®
MLS Number: 205496
APN: 032600-101-003-0001-018-000-0000
Nearby Homes
- 1734 E Windsor Rd
- 30 Maple St
- 3537 State Route 79
- 65 Still Rd
- 27 Still Rd
- 0 New York 7 Unit 22484298
- 159 County Road 26
- 0 County Road 26
- 252 Harris Rd
- 10 Pratt Rd
- 112 Bettsburgh Rd
- 115 Mountain Rd
- 109 Mountain Rd
- 245 Mountain Rd
- 219 Martin Hill Rd
- 4915 New York 79
- 700 E Windsor Rd
- 245 Dutchtown Rd
- 572 Martin Hill Rd
- 209 Perry Rd
- 46 Dyer Flat Rd
- 61 Dyer Flat Rd
- 33 Dyer Flat Rd
- 96 Dyer Flat Rd
- 128 Dyer Flat Rd
- 102 Dyer Flat Rd
- 102 Dyer Flat Rd
- 148 Dyer Flat Rd
- 110 Dyer Flat Rd
- 11 Riverview Place
- 259 Centerville Loop Rd
- 144 Dyer Flat Rd
- 1 Dyer Flat Rd
- 138 Dyer Flat Rd
- 276 Centerville Loop Rd
- 129 Dyer Flat Rd
- 146 Dyer Flat Rd
- 154 Dyer Flat Rd
- 3360 State Route 79
- 136 Riverview Place