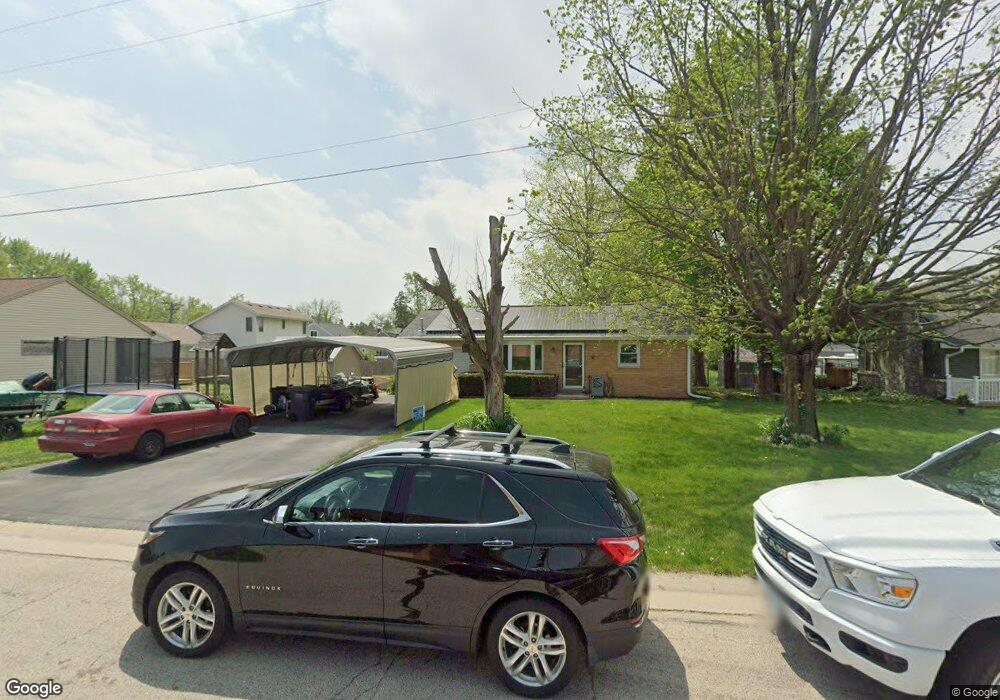
W227S8945 Saint Joseph Dr Big Bend, WI 53103
Estimated Value: $229,077 - $347,000
2
Beds
1
Bath
--
Sq Ft
10,454
Sq Ft Lot
About This Home
This home is located at W227S8945 Saint Joseph Dr, Big Bend, WI 53103 and is currently estimated at $301,769. W227S8945 Saint Joseph Dr is a home located in Waukesha County with nearby schools including Big Bend Elementary School, Park View Middle School, and Mukwonago High School.
Ownership History
Date
Name
Owned For
Owner Type
Purchase Details
Closed on
Jun 30, 2000
Sold by
Va
Bought by
Nimmer Dwane C and Nimmer Pamela
Current Estimated Value
Home Financials for this Owner
Home Financials are based on the most recent Mortgage that was taken out on this home.
Original Mortgage
$101,344
Outstanding Balance
$36,367
Interest Rate
8.27%
Mortgage Type
FHA
Estimated Equity
$265,402
Purchase Details
Closed on
Feb 26, 2000
Sold by
Fleet Mtg Corp
Bought by
Va
Purchase Details
Closed on
Jan 17, 2000
Sold by
Petrie Daniel T and Doe Jane
Bought by
Fleet Mtg Corp and Fleet Real Estate Funding Corp
Purchase Details
Closed on
Oct 17, 1997
Sold by
Fickau Paul and Loomis Elizabeth
Bought by
Petrie Daniel T
Home Financials for this Owner
Home Financials are based on the most recent Mortgage that was taken out on this home.
Original Mortgage
$86,500
Interest Rate
7.51%
Mortgage Type
VA
Create a Home Valuation Report for This Property
The Home Valuation Report is an in-depth analysis detailing your home's value as well as a comparison with similar homes in the area
Home Values in the Area
Average Home Value in this Area
Purchase History
| Date | Buyer | Sale Price | Title Company |
|---|---|---|---|
| Nimmer Dwane C | -- | -- | |
| Va | $88,200 | -- | |
| Fleet Mtg Corp | $88,130 | -- | |
| Petrie Daniel T | $86,500 | -- |
Source: Public Records
Mortgage History
| Date | Status | Borrower | Loan Amount |
|---|---|---|---|
| Open | Nimmer Dwane C | $101,344 | |
| Previous Owner | Petrie Daniel T | $86,500 |
Source: Public Records
Tax History Compared to Growth
Tax History
| Year | Tax Paid | Tax Assessment Tax Assessment Total Assessment is a certain percentage of the fair market value that is determined by local assessors to be the total taxable value of land and additions on the property. | Land | Improvement |
|---|---|---|---|---|
| 2024 | $1,725 | $155,100 | $58,600 | $96,500 |
| 2023 | $1,656 | $155,100 | $58,600 | $96,500 |
| 2022 | $2,126 | $134,900 | $53,000 | $81,900 |
| 2021 | $2,164 | $134,900 | $53,000 | $81,900 |
| 2020 | $2,241 | $134,900 | $53,000 | $81,900 |
| 2019 | $2,144 | $134,900 | $53,000 | $81,900 |
| 2018 | $2,254 | $134,900 | $53,000 | $81,900 |
| 2017 | $2,228 | $134,900 | $53,000 | $81,900 |
| 2016 | $2,130 | $134,900 | $53,000 | $81,900 |
| 2015 | $1,999 | $134,900 | $53,000 | $81,900 |
| 2014 | $2,158 | $134,900 | $53,000 | $81,900 |
| 2013 | $2,158 | $134,900 | $53,000 | $81,900 |
Source: Public Records
Map
Nearby Homes
- Lt2 Marianne Ave
- Pcl0 Clark St
- Lt11 Leo Ln
- Lt12 Leo Ln
- Lt7 Leo Ln
- Lt8 Leo Ln
- Lt9 Leo Ln
- Lt10 Leo Ln
- Lt13 Leo Ln
- Lt14 Leo Ln
- Lt15 Leo Ln
- Lt16 Leo Ln
- S95W23000 River Oaks Dr
- S95W22835 Bywater Ln
- S96W22870 River Oaks Dr
- S83W23145 Artesian Ave
- W232S8430 Rosemary Dr
- S94W23620 Kunzendorf Ct
- S80W23790 Parkview Dr
- Lt2 Russet Ct
- W227S8935 Saint Joseph Dr
- S89W22700 Milwaukee Ave
- W227S8925 Saint Joseph Dr
- S89W22720 Milwaukee Ave
- S89W22710 Milwaukee Ave
- W227S8980 Marianne Ave
- W227S8960 Marianne Ave
- W227S8915 Saint Joseph Dr
- S89W22730 Milwaukee Ave
- W227S8940 Marianne Ave
- S89W22665 Spring St
- S89W22685 Spring St
- W227S8905 Saint Joseph Dr
- W227S8900 Marianne Ave
- S89W22705 Spring St
- S89W22655 Milwaukee Ave
- W227S8965 Marianne Ave
- S89W22715 Spring St
- W227S8985 Marianne Ave
- W227S8920 Marianne Ave