

0 Deer Hollow Ct Unit 25-5011 Redding, CA 96001
Estimated payment $995/month
Highlights
- Partially Fenced Property
- Grant Elementary School Rated A
- Level Lot
About This Lot
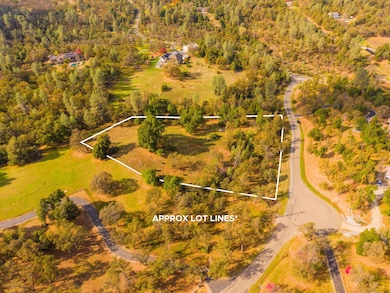
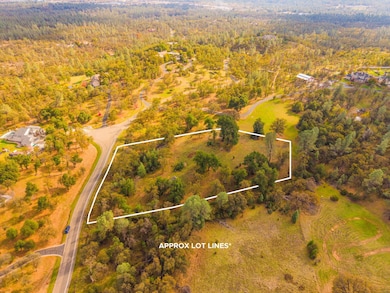
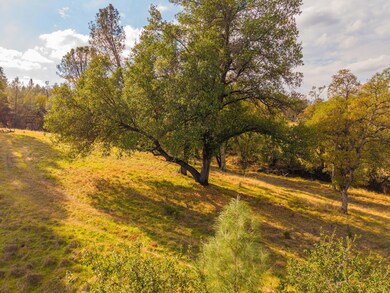
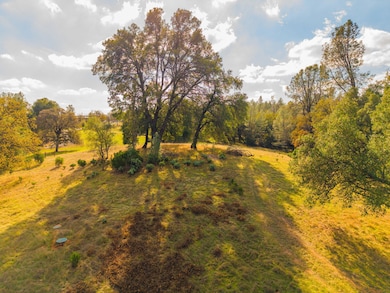
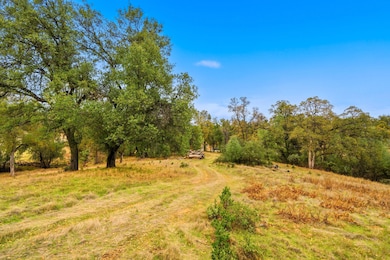
Beautiful 3-acre parcel with a picturesque knoll setting surrounded by mature oak trees. Located in desirable West Redding on a quiet, private cul-de-sac. Septic system is already installed, making this an ideal canvas to build your dream home. Enjoy privacy, natural beauty, and the peaceful setting you've been looking for- just minutes from downtown. Don't miss this wonderful opportunity.
Property Details
Property Type
- Land
Est. Annual Taxes
- $1,498
Lot Details
- 3.03 Acre Lot
- Partially Fenced Property
- Level Lot
- Zoning described as RED - RS Residential Single-Family
Listing and Financial Details
- Assessor Parcel Number 208-330-005-000
Map
Home Values in the Area
Average Home Value in this Area
Tax History
| Year | Tax Paid | Tax Assessment Tax Assessment Total Assessment is a certain percentage of the fair market value that is determined by local assessors to be the total taxable value of land and additions on the property. | Land | Improvement |
|---|---|---|---|---|
| 2025 | $1,498 | $137,955 | $130,528 | $7,427 |
| 2024 | $1,473 | $135,251 | $127,969 | $7,282 |
| 2023 | $1,473 | $132,600 | $125,460 | $7,140 |
| 2022 | $1,437 | $130,000 | $123,000 | $7,000 |
| 2021 | $1,033 | $90,792 | $84,094 | $6,698 |
| 2020 | $1,132 | $89,862 | $83,232 | $6,630 |
| 2019 | $980 | $81,600 | $81,600 | $0 |
| 2018 | $1,029 | $80,000 | $80,000 | $0 |
| 2017 | $1,335 | $114,260 | $114,260 | $0 |
| 2016 | $1,303 | $112,020 | $112,020 | $0 |
| 2015 | $1,315 | $110,338 | $110,338 | $0 |
| 2014 | -- | $108,177 | $108,177 | $0 |
Property History
| Date | Event | Price | List to Sale | Price per Sq Ft |
|---|---|---|---|---|
| 11/07/2025 11/07/25 | For Sale | $165,000 | -- | -- |
Purchase History
| Date | Type | Sale Price | Title Company |
|---|---|---|---|
| Grant Deed | -- | None Listed On Document | |
| Grant Deed | $130,000 | Fidelity Natl Ttl Co Of Ca | |
| Grant Deed | $80,000 | Fidelity Natl Title Co Of Ca |
Mortgage History
| Date | Status | Loan Amount | Loan Type |
|---|---|---|---|
| Previous Owner | $50,000 | Commercial |
Source: Shasta Association of REALTORS®
MLS Number: 25-5011
APN: 208-330-005-000
Disclaimer: Certain information contained herein is derived from information provided by parties other than Homes.com. All information provided is deemed reliable, but is not guaranteed to be accurate and should be independently verified.
![]() IDX information is provided exclusively for personal, non-commercial use, and may not be used for any purpose other than to identify prospective properties consumers may be interested in purchasing. Information is deemed reliable but not guaranteed.
IDX information is provided exclusively for personal, non-commercial use, and may not be used for any purpose other than to identify prospective properties consumers may be interested in purchasing. Information is deemed reliable but not guaranteed.
- 16107 Texas Springs Rd
- 15900 El Camino Robles Rd
- 000 Montgomery Ranch Rd
- 16300 Canto de Las Lupine Dr
- 15888 El Camino Robles Rd
- Lot 1 Canto de Las Lupine
- 26.27Acres Canto de Las Lupine Dr
- 5.26 Acres Canto de Las Lupine Dr
- 18.29Acres Canto de Las Lupine Dr
- 4.36 Acres Canto de Las Lupine Dr
- Lot 9 Canto de Las Lupine Dr
- 5.77 Acres Canto de Las Lupine Dr
- 8221 Placer Rd
- 0 Honeybee Rd
- 00 Honeybee Rd
- 7384 Honeybee Rd
- 8499 Simmons Rd
- 7780 Raven Rd
- 7954 Placer Rd
- 7891 Placer Rd
- 3390 Cutlas Ct Unit B
- 880 Congaree Ln
- 1765 Laurel Ave Unit Condo A
- 2512 Butte St
- 1360 Orange Ave
- 1132 Walnut Ave Unit BUNGALOW
- 1132 Walnut Ave
- 2142 Butte St
- 2214 Waldon St
- 2045 Shasta St
- 590 Dee Ct
- 4264 Jane St
- 4264 Jane St
- 683 Joaquin Ave
- 1300 Market St Unit 204
- 540 South St
- 3429 Adams Ln
- 4433 Cynthia Way
- 3067 Northwoods Way
- 2070 Bechelli Ln Unit 22
