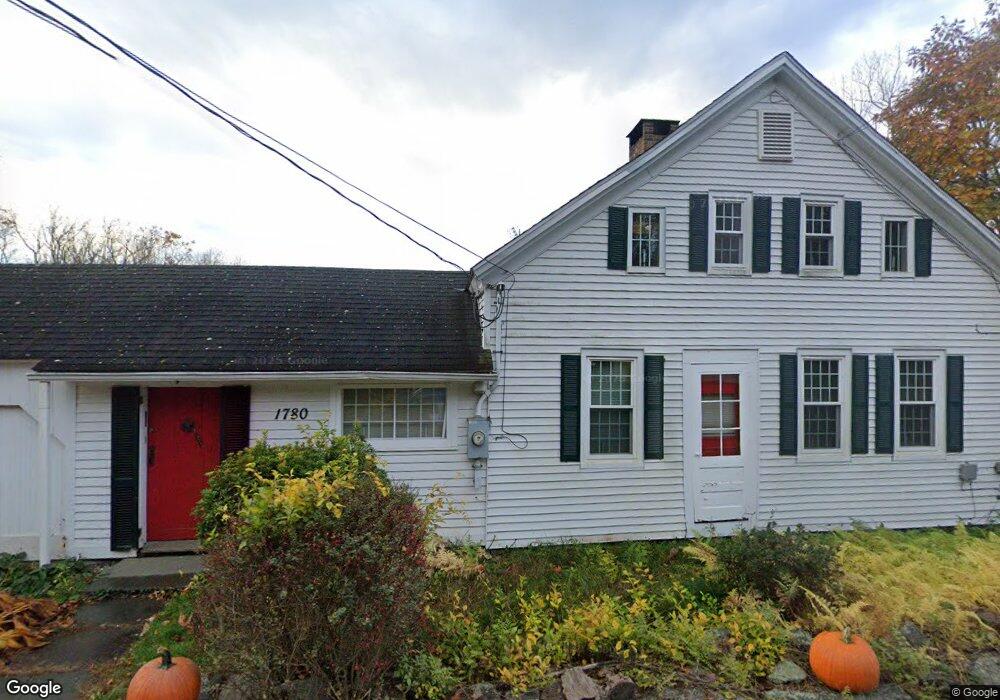
09 Lane Hill Rd Terryville, CT 06786
Estimated Value: $374,998 - $466,000
4
Beds
2
Baths
2,218
Sq Ft
$187/Sq Ft
Est. Value
About This Home
This home is located at 09 Lane Hill Rd, Terryville, CT 06786 and is currently estimated at $415,000, approximately $187 per square foot. 09 Lane Hill Rd is a home located in Litchfield County with nearby schools including Plymouth Center School, Eli Terry Jr. Middle School, and Terryville High School.
Ownership History
Date
Name
Owned For
Owner Type
Purchase Details
Closed on
Apr 12, 2017
Sold by
Wells Fargo Bank Na
Bought by
Buanocore Ralph
Current Estimated Value
Home Financials for this Owner
Home Financials are based on the most recent Mortgage that was taken out on this home.
Original Mortgage
$116,186
Outstanding Balance
$96,392
Interest Rate
4.1%
Mortgage Type
Future Advance Clause Open End Mortgage
Estimated Equity
$318,608
Purchase Details
Closed on
Jul 7, 2014
Sold by
Knapik John and Wells Fargo Bank Na
Bought by
Wells Fargo Bank Na
Purchase Details
Closed on
Dec 16, 2009
Sold by
Tolles Kathryne M
Bought by
Knapik John and Knapik Lance Tommi
Home Financials for this Owner
Home Financials are based on the most recent Mortgage that was taken out on this home.
Original Mortgage
$204,232
Interest Rate
4.79%
Create a Home Valuation Report for This Property
The Home Valuation Report is an in-depth analysis detailing your home's value as well as a comparison with similar homes in the area
Home Values in the Area
Average Home Value in this Area
Purchase History
| Date | Buyer | Sale Price | Title Company |
|---|---|---|---|
| Buanocore Ralph | $72,000 | -- | |
| Buanocore Ralph | $72,000 | -- | |
| Wells Fargo Bank Na | -- | -- | |
| Wells Fargo Bank Na | -- | -- | |
| Knapik John | $208,000 | -- | |
| Knapik John | $208,000 | -- |
Source: Public Records
Mortgage History
| Date | Status | Borrower | Loan Amount |
|---|---|---|---|
| Open | Knapik John | $116,186 | |
| Closed | Knapik John | $116,186 | |
| Previous Owner | Knapik John | $204,232 |
Source: Public Records
Tax History Compared to Growth
Tax History
| Year | Tax Paid | Tax Assessment Tax Assessment Total Assessment is a certain percentage of the fair market value that is determined by local assessors to be the total taxable value of land and additions on the property. | Land | Improvement |
|---|---|---|---|---|
| 2025 | $6,013 | $151,970 | $55,930 | $96,040 |
| 2024 | $5,872 | $151,970 | $55,930 | $96,040 |
| 2023 | $5,729 | $151,970 | $55,930 | $96,040 |
| 2022 | $5,520 | $151,970 | $55,930 | $96,040 |
| 2021 | $5,162 | $127,057 | $56,700 | $70,357 |
| 2020 | $5,162 | $127,057 | $56,700 | $70,357 |
| 2019 | $5,162 | $127,057 | $56,700 | $70,357 |
| 2016 | $5,215 | $144,781 | $65,310 | $79,471 |
| 2015 | $5,130 | $144,781 | $65,310 | $79,471 |
| 2014 | $5,046 | $144,781 | $65,310 | $79,471 |
Source: Public Records
Map
Nearby Homes
- 275 Allentown Rd
- 41 Fall Mountain Lake Rd
- 353 Allentown Rd
- 4 Fall Mountain Terrace
- 27 Club Ln
- 93-95 Eastview Rd
- 22 Overlook Terrace
- 13 Overlook Terrace
- 510 Allentown Rd
- 174 Town Line Rd
- 10 Country Garden Ct
- 101 Corbin Ridge
- 123 Corbin Ridge
- 140 Corbin Ridge
- 145 Corbin Ridge
- 156 Corbin Ridge
- 65 Meyers Rd
- 355 Fall Mountain Rd
- 32 Cameron Dr
- 351 Witches Rock Rd
- 9 Lane Hill Rd
- 1 Lane Hill Rd
- 91 Allentown Rd
- 43 Lane Hill Rd
- 22 Lane Hill Rd
- 216 Allentown Rd
- 219 Allentown Rd
- 238 Allentown Rd
- 26 Lane Hill Rd
- 139 Allentown Rd
- 162 Allentown Rd
- 153 Allentown Rd
- 74 Lane Hill Rd
- 10 Lane Hill Rd
- 99 Allentown Rd
- 158 Allentown Rd
- 180 Allentown Rd
- 152 Allentown Rd
- 42 Lane Hill Rd