1 Balise Ln Foothill Ranch, CA 92610
Estimated Value: $1,158,000 - $1,241,011
3
Beds
3
Baths
1,624
Sq Ft
$738/Sq Ft
Est. Value
About This Home
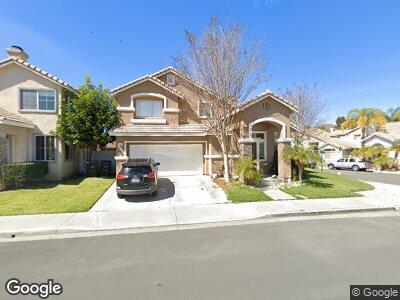
This home is located at 1 Balise Ln, Foothill Ranch, CA 92610 and is currently estimated at $1,198,503, approximately $737 per square foot. 1 Balise Ln is a home located in Orange County with nearby schools including Foothill Ranch Elementary School, Rancho Santa Margarita Intermediate School, and Trabuco Hills High School.
Ownership History
Date
Name
Owned For
Owner Type
Purchase Details
Closed on
Oct 1, 2021
Sold by
Germond Et
Bought by
Crawford Kristin Ayne and Crawford Elmer Thayer
Current Estimated Value
Purchase Details
Closed on
Jan 28, 2002
Sold by
Taylor Michael A and Taylor Lorie A
Bought by
Germond E T
Home Financials for this Owner
Home Financials are based on the most recent Mortgage that was taken out on this home.
Original Mortgage
$195,000
Interest Rate
7.13%
Purchase Details
Closed on
Mar 1, 1995
Sold by
Centex Real Estate Corp
Bought by
Taylor Michael A and Taylor Lorie A
Home Financials for this Owner
Home Financials are based on the most recent Mortgage that was taken out on this home.
Original Mortgage
$153,350
Interest Rate
8.43%
Create a Home Valuation Report for This Property
The Home Valuation Report is an in-depth analysis detailing your home's value as well as a comparison with similar homes in the area
Home Values in the Area
Average Home Value in this Area
Purchase History
| Date | Buyer | Sale Price | Title Company |
|---|---|---|---|
| Crawford Kristin Ayne | -- | None Available | |
| Germond E T | $335,500 | Equity Title | |
| Taylor Michael A | $192,000 | First American Title Ins Co |
Source: Public Records
Mortgage History
| Date | Status | Borrower | Loan Amount |
|---|---|---|---|
| Open | Germond E T | $174,000 | |
| Closed | Germond E T | $195,000 | |
| Closed | Germond E T | $195,000 | |
| Previous Owner | Taylor Michael A | $155,000 | |
| Previous Owner | Taylor Michael A | $153,350 |
Source: Public Records
Tax History Compared to Growth
Tax History
| Year | Tax Paid | Tax Assessment Tax Assessment Total Assessment is a certain percentage of the fair market value that is determined by local assessors to be the total taxable value of land and additions on the property. | Land | Improvement |
|---|---|---|---|---|
| 2024 | $5,000 | $485,181 | $226,566 | $258,615 |
| 2023 | $4,881 | $475,668 | $222,123 | $253,545 |
| 2022 | $4,793 | $466,342 | $217,768 | $248,574 |
| 2021 | $4,077 | $457,199 | $213,499 | $243,700 |
| 2020 | $4,654 | $452,511 | $211,309 | $241,202 |
| 2019 | $4,560 | $443,639 | $207,166 | $236,473 |
| 2018 | $4,473 | $434,941 | $203,104 | $231,837 |
| 2017 | $4,353 | $426,413 | $199,121 | $227,292 |
| 2016 | $4,986 | $418,052 | $195,216 | $222,836 |
| 2015 | $4,976 | $411,773 | $192,284 | $219,489 |
| 2014 | $5,527 | $403,707 | $188,517 | $215,190 |
Source: Public Records
Map
Nearby Homes
- 23 Beaulieu Ln
- 20 Beaulieu Ln
- 19431 Rue de Valore Unit 1G
- 19431 Rue de Valore Unit 31F
- 19431 Rue de Valore Unit 39D
- 19431 Rue de Valore Unit 44B
- 19431 Rue de Valore Unit 14D
- 219 Chaumont Cir
- 232 Chaumont Cir
- 4 Carillon Place
- 42 Parterre Ave
- 5 Blanco
- 6 Corozal
- 56 Tessera Ave
- 606 El Paseo
- 22 Sierra Blanco
- 906 El Paseo
- 115 Primrose Dr
- 15 Cantora
- 30 Galeana