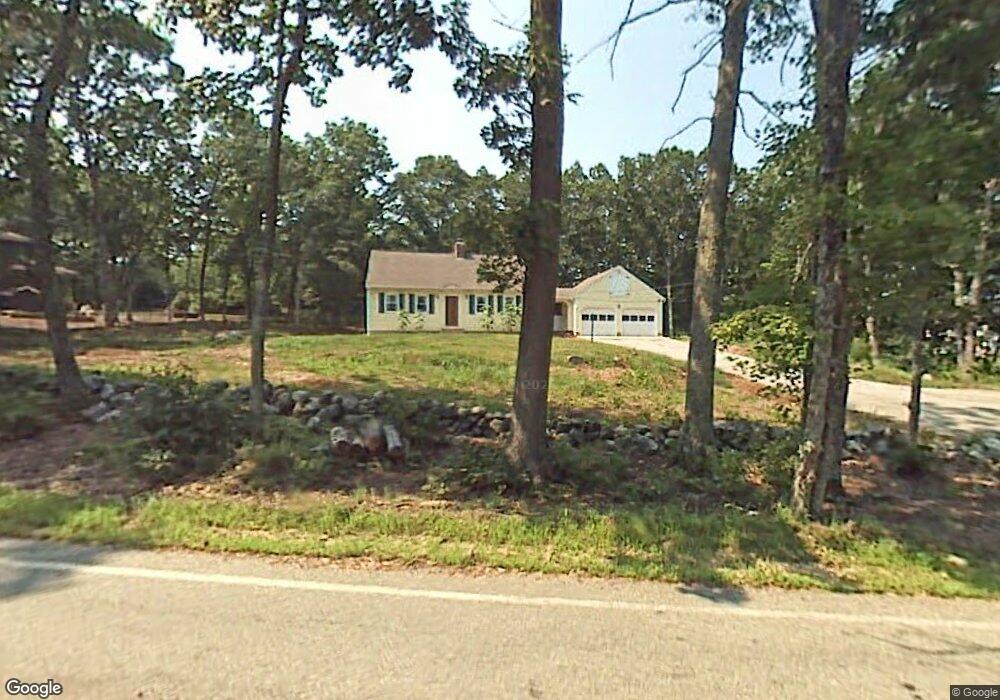
1 Bates Rd MerriMacK, NH 03054
Estimated Value: $561,231 - $626,000
3
Beds
2
Baths
1,799
Sq Ft
$334/Sq Ft
Est. Value
About This Home
This home is located at 1 Bates Rd, MerriMacK, NH 03054 and is currently estimated at $601,558, approximately $334 per square foot. 1 Bates Rd is a home located in Hillsborough County with nearby schools including Thorntons Ferry School, Merrimack Middle School, and James Mastricola Upper Elementary School.
Ownership History
Date
Name
Owned For
Owner Type
Purchase Details
Closed on
Jun 3, 2008
Sold by
Riley Jeffrey and Riley Scarlett
Bought by
Williams Gregory A and Burris Teresa M
Current Estimated Value
Home Financials for this Owner
Home Financials are based on the most recent Mortgage that was taken out on this home.
Original Mortgage
$259,650
Interest Rate
5.91%
Mortgage Type
Purchase Money Mortgage
Purchase Details
Closed on
Jun 15, 2004
Sold by
Carroll Raymond E and Carroll Linda S
Bought by
Riley Jeffrey C and Riley Scarlett D
Home Financials for this Owner
Home Financials are based on the most recent Mortgage that was taken out on this home.
Original Mortgage
$218,700
Interest Rate
5.99%
Mortgage Type
Purchase Money Mortgage
Create a Home Valuation Report for This Property
The Home Valuation Report is an in-depth analysis detailing your home's value as well as a comparison with similar homes in the area
Home Values in the Area
Average Home Value in this Area
Purchase History
| Date | Buyer | Sale Price | Title Company |
|---|---|---|---|
| Williams Gregory A | $288,500 | -- | |
| Riley Jeffrey C | $273,400 | -- |
Source: Public Records
Mortgage History
| Date | Status | Borrower | Loan Amount |
|---|---|---|---|
| Open | Riley Jeffrey C | $254,500 | |
| Closed | Riley Jeffrey C | $259,650 | |
| Previous Owner | Riley Jeffrey C | $218,700 |
Source: Public Records
Tax History Compared to Growth
Tax History
| Year | Tax Paid | Tax Assessment Tax Assessment Total Assessment is a certain percentage of the fair market value that is determined by local assessors to be the total taxable value of land and additions on the property. | Land | Improvement |
|---|---|---|---|---|
| 2024 | $7,997 | $386,500 | $209,300 | $177,200 |
| 2023 | $7,517 | $386,500 | $209,300 | $177,200 |
| 2022 | $6,717 | $386,500 | $209,300 | $177,200 |
| 2021 | $6,636 | $386,500 | $209,300 | $177,200 |
| 2020 | $6,833 | $284,000 | $146,600 | $137,400 |
| 2019 | $6,853 | $284,000 | $146,600 | $137,400 |
| 2018 | $6,850 | $284,000 | $146,600 | $137,400 |
| 2017 | $6,637 | $284,000 | $146,600 | $137,400 |
| 2016 | $6,472 | $284,000 | $146,600 | $137,400 |
| 2015 | $6,496 | $262,800 | $136,200 | $126,600 |
| 2014 | $6,331 | $262,800 | $136,200 | $126,600 |
| 2013 | $6,284 | $262,800 | $136,200 | $126,600 |
Source: Public Records
Map
Nearby Homes
- 80 Peaslee Rd
- 103 Seaverns Bridge Rd
- 105 Seaverns Bridge Rd
- 101-2 Seaverns Bridge Rd
- 1 County Rd
- 15 Four Winds Rd
- 6 Mason Rd
- 11 Queens Way
- 148 County Rd
- 150 County Rd Unit 4-142-8
- 150 County Rd
- 24 Deerwood Dr
- 25 Eastern Ave
- 9 Cambridge Dr
- 2 County Rd
- 27 Sarah Dr
- 40 Captain Bannon Cir
- 6 Veterans Rd Unit 15
- 3 Roedean Dr Unit C-207
- 40 Turkey Hill Rd