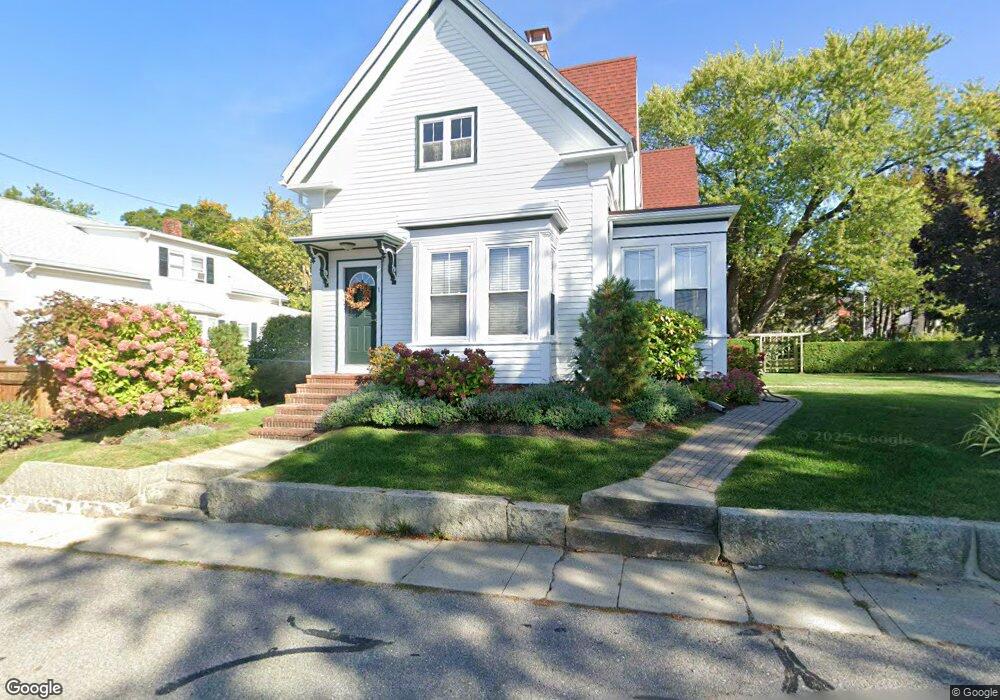
1 Blake Ct Gloucester, MA 01930
East Gloucester NeighborhoodEstimated Value: $661,247 - $940,000
3
Beds
3
Baths
1,514
Sq Ft
$519/Sq Ft
Est. Value
About This Home
This home is located at 1 Blake Ct, Gloucester, MA 01930 and is currently estimated at $785,312, approximately $518 per square foot. 1 Blake Ct is a home located in Essex County with nearby schools including East Gloucester Elementary School, Ralph B O'maley Middle School, and Gloucester High School.
Ownership History
Date
Name
Owned For
Owner Type
Purchase Details
Closed on
Sep 16, 1988
Sold by
Zellenka Ludwig F
Bought by
Mckinnon Joh D
Current Estimated Value
Home Financials for this Owner
Home Financials are based on the most recent Mortgage that was taken out on this home.
Original Mortgage
$160,000
Interest Rate
10.43%
Mortgage Type
Purchase Money Mortgage
Create a Home Valuation Report for This Property
The Home Valuation Report is an in-depth analysis detailing your home's value as well as a comparison with similar homes in the area
Home Values in the Area
Average Home Value in this Area
Purchase History
| Date | Buyer | Sale Price | Title Company |
|---|---|---|---|
| Mckinnon Joh D | $200,000 | -- |
Source: Public Records
Mortgage History
| Date | Status | Borrower | Loan Amount |
|---|---|---|---|
| Closed | Mckinnon Joh D | $157,500 | |
| Closed | Mckinnon Joh D | $161,250 | |
| Closed | Mckinnon Joh D | $160,000 |
Source: Public Records
Tax History
| Year | Tax Paid | Tax Assessment Tax Assessment Total Assessment is a certain percentage of the fair market value that is determined by local assessors to be the total taxable value of land and additions on the property. | Land | Improvement |
|---|---|---|---|---|
| 2025 | $5,572 | $573,200 | $219,700 | $353,500 |
| 2024 | $5,476 | $562,800 | $209,300 | $353,500 |
| 2023 | $5,246 | $495,400 | $186,800 | $308,600 |
| 2022 | $5,031 | $428,900 | $158,800 | $270,100 |
| 2021 | $4,853 | $390,100 | $144,400 | $245,700 |
| 2020 | $4,788 | $388,300 | $144,400 | $243,900 |
| 2019 | $4,598 | $362,300 | $144,400 | $217,900 |
| 2018 | $4,461 | $345,000 | $144,400 | $200,600 |
| 2017 | $4,324 | $327,800 | $137,600 | $190,200 |
| 2016 | $4,195 | $308,200 | $138,100 | $170,100 |
| 2015 | $4,028 | $295,100 | $138,100 | $157,000 |
Source: Public Records
Map
Nearby Homes
- 3 Mondello Square
- 70 Bass Ave
- 5 Wise Place
- 36 Eastern Ave
- 197 E Main St Unit 1
- 139A Prospect St
- 14R Spring St Unit 3
- 26 Marina Dr
- 60 Rocky Neck Ave Unit 202
- 73 Rocky Neck Ave Unit 2
- 191 Main St Unit 3
- 191 Main St Unit 2A
- 19 Trask St Unit 2
- 50 Warner St
- 1 Wonson St
- 10 Seaview Rd
- 113 Pleasant St
- 40 Sargent St
- 70 Old Nugent Farm Rd
- 33 Maplewood Ave Unit 310
Your Personal Tour Guide
Ask me questions while you tour the home.