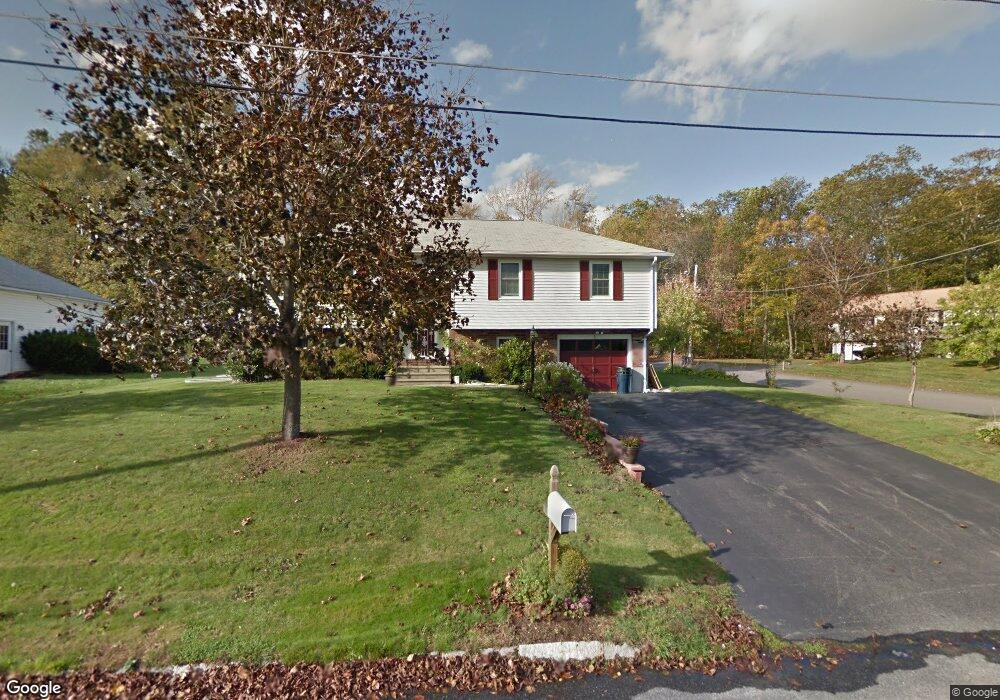
1 Brookside Ln Milford, MA 01757
Estimated Value: $544,000 - $647,000
3
Beds
2
Baths
2,055
Sq Ft
$290/Sq Ft
Est. Value
About This Home
This home is located at 1 Brookside Ln, Milford, MA 01757 and is currently estimated at $596,285, approximately $290 per square foot. 1 Brookside Ln is a home located in Worcester County with nearby schools including Milford High School and Bethany Christian Academy.
Ownership History
Date
Name
Owned For
Owner Type
Purchase Details
Closed on
Jun 28, 2018
Sold by
Goncalves Joao and Goncalves Maria L
Bought by
Goncalves Joao and Goncalves Maria L
Current Estimated Value
Purchase Details
Closed on
Apr 30, 2004
Sold by
Sunnyside Rt and Ahmed Mujeebuddin
Bought by
Sims Bonnie J
Home Financials for this Owner
Home Financials are based on the most recent Mortgage that was taken out on this home.
Original Mortgage
$100,000
Interest Rate
5.36%
Mortgage Type
Purchase Money Mortgage
Purchase Details
Closed on
Apr 9, 1985
Bought by
Goncalves Joao and Goncalves Maria L
Create a Home Valuation Report for This Property
The Home Valuation Report is an in-depth analysis detailing your home's value as well as a comparison with similar homes in the area
Home Values in the Area
Average Home Value in this Area
Purchase History
| Date | Buyer | Sale Price | Title Company |
|---|---|---|---|
| Goncalves Joao | -- | -- | |
| Sims Bonnie J | $125,000 | -- | |
| Goncalves Joao | $100,300 | -- |
Source: Public Records
Mortgage History
| Date | Status | Borrower | Loan Amount |
|---|---|---|---|
| Previous Owner | Sims Bonnie J | $100,000 |
Source: Public Records
Tax History
| Year | Tax Paid | Tax Assessment Tax Assessment Total Assessment is a certain percentage of the fair market value that is determined by local assessors to be the total taxable value of land and additions on the property. | Land | Improvement |
|---|---|---|---|---|
| 2025 | $6,380 | $498,400 | $185,900 | $312,500 |
| 2024 | $6,254 | $470,600 | $178,500 | $292,100 |
| 2023 | $5,920 | $409,700 | $154,300 | $255,400 |
| 2022 | $5,785 | $375,900 | $141,300 | $234,600 |
| 2021 | $5,839 | $365,400 | $141,300 | $224,100 |
| 2020 | $5,734 | $359,300 | $141,300 | $218,000 |
| 2019 | $5,415 | $327,400 | $141,300 | $186,100 |
| 2018 | $5,201 | $314,100 | $137,600 | $176,500 |
| 2017 | $5,091 | $303,200 | $137,600 | $165,600 |
| 2016 | $4,850 | $282,300 | $137,600 | $144,700 |
| 2015 | $4,695 | $267,500 | $130,100 | $137,400 |
Source: Public Records
Map
Nearby Homes
- 59 Lawrence St
- 9 Packard Rd
- 2 Lee St Unit B
- 8 Bandy Ln
- 14 Lawrence St
- 6 Correia Cir Unit B
- 11 Deluca Rd
- 11 Country Club Ln Unit D
- 37 Godfrey Ln
- 14 Country Club Ln Unit C
- 8 Country Club Ln Unit B
- 4-6 State St
- 6 Park Terrace
- 14 C Country Club Ln
- 0 West St
- 10 Yale Dr
- 9 Granite St
- 6 1/2 Leonard St
- 2 Northrop St
- 33 Chestnut St
Your Personal Tour Guide
Ask me questions while you tour the home.