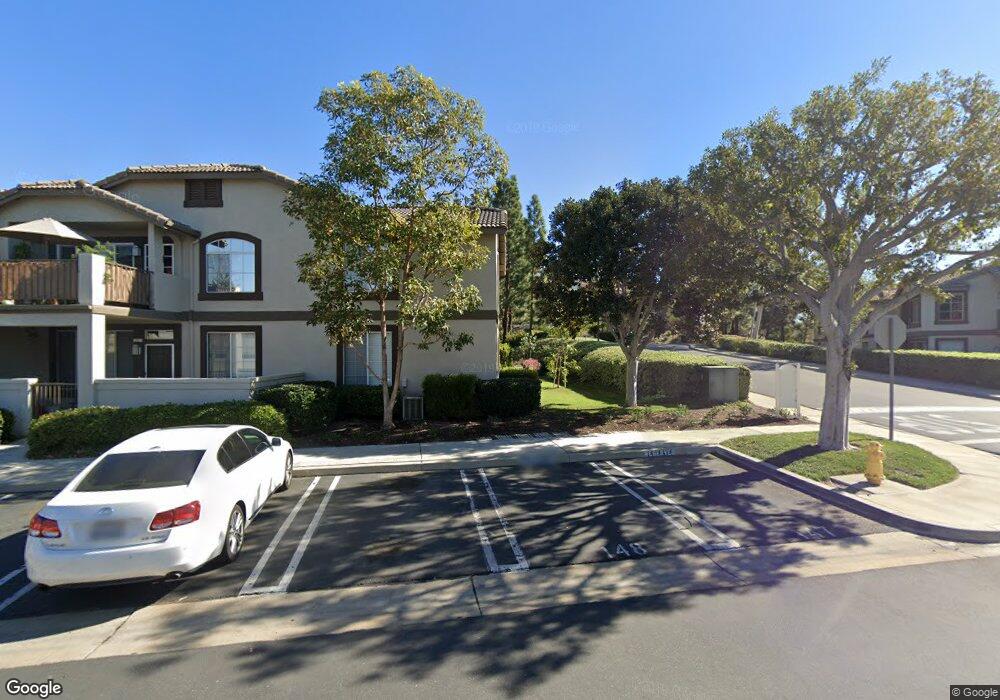
1 Chaumont Cir Unit 7 Foothill Ranch, CA 92610
Estimated Value: $638,000 - $749,000
3
Beds
2
Baths
1,104
Sq Ft
$621/Sq Ft
Est. Value
About This Home
This home is located at 1 Chaumont Cir Unit 7, Foothill Ranch, CA 92610 and is currently estimated at $685,507, approximately $620 per square foot. 1 Chaumont Cir Unit 7 is a home located in Orange County with nearby schools including Foothill Ranch Elementary School, Rancho Santa Margarita Intermediate School, and Trabuco Hills High School.
Ownership History
Date
Name
Owned For
Owner Type
Purchase Details
Closed on
Dec 23, 2008
Sold by
Oberg Linda L
Bought by
Stransky Linda Lee Oberg and Linda Lee Oberg Stransky Living Trust
Current Estimated Value
Purchase Details
Closed on
Apr 17, 2002
Sold by
Deloye Steven and Deloye Darlene
Bought by
Oberg Linda L and Runkle David
Purchase Details
Closed on
Mar 9, 1998
Sold by
Hud
Bought by
Deloye Steven and Deloye Darlene
Home Financials for this Owner
Home Financials are based on the most recent Mortgage that was taken out on this home.
Original Mortgage
$143,123
Interest Rate
7%
Mortgage Type
FHA
Purchase Details
Closed on
Sep 4, 1997
Sold by
Norwest Mtg Inc
Bought by
Hud
Purchase Details
Closed on
Jun 20, 1997
Sold by
Swain Robert A and Swain Lorraine L
Bought by
Norwest Mtg Inc and Norwest Corp
Create a Home Valuation Report for This Property
The Home Valuation Report is an in-depth analysis detailing your home's value as well as a comparison with similar homes in the area
Home Values in the Area
Average Home Value in this Area
Purchase History
| Date | Buyer | Sale Price | Title Company |
|---|---|---|---|
| Stransky Linda Lee Oberg | -- | None Available | |
| Oberg Linda L | -- | None Available | |
| Oberg Linda L | $240,000 | Commerce Title | |
| Deloye Steven | $148,000 | Chicago Title Co | |
| Hud | -- | Fidelity National Title Ins | |
| Norwest Mtg Inc | $145,661 | -- |
Source: Public Records
Mortgage History
| Date | Status | Borrower | Loan Amount |
|---|---|---|---|
| Previous Owner | Deloye Steven | $143,123 |
Source: Public Records
Tax History Compared to Growth
Tax History
| Year | Tax Paid | Tax Assessment Tax Assessment Total Assessment is a certain percentage of the fair market value that is determined by local assessors to be the total taxable value of land and additions on the property. | Land | Improvement |
|---|---|---|---|---|
| 2025 | $3,600 | $349,971 | $205,022 | $144,949 |
| 2024 | $3,600 | $343,109 | $201,002 | $142,107 |
| 2023 | $3,515 | $336,382 | $197,061 | $139,321 |
| 2022 | $3,453 | $329,787 | $193,197 | $136,590 |
| 2021 | $3,115 | $323,321 | $189,409 | $133,912 |
| 2020 | $3,354 | $320,006 | $187,467 | $132,539 |
| 2019 | $3,287 | $313,732 | $183,791 | $129,941 |
| 2018 | $3,226 | $307,581 | $180,187 | $127,394 |
| 2017 | $3,162 | $301,550 | $176,653 | $124,897 |
| 2016 | $3,417 | $295,638 | $173,189 | $122,449 |
| 2015 | $3,398 | $291,198 | $170,588 | $120,610 |
| 2014 | $3,611 | $285,494 | $167,246 | $118,248 |
Source: Public Records
Map
Nearby Homes
- 19431 14H Rue de Valore
- 19431 Rue de Valore Unit 37A
- 5 Encinal
- 131 Primrose Dr
- 32 Salinas
- 7 Pandale
- 109 Alder Ridge
- 104 Alder Ridge
- 19415 Cascade Dr Unit 234
- 1865 Aliso Canyon Dr
- 19222 Red Bluff Dr
- 1582 Sunset View Dr
- 1552 Sunset View Dr
- 19613 Orviento Dr
- 19322 Brushwood Ln
- 98 Pinnacle Dr
- 28476 Sassetta Way
- 1186 Viejo Hills Dr
- 200 Sierra Madre
- 215 Bryce Run
- 3 Chaumont Cir
- 5 Chaumont Cir
- 7 Chaumont Cir
- 9 Chaumont Cir
- 11 Chaumont Cir Unit 6
- 15 Chaumont Cir
- 17 Chaumont Cir Unit 10
- 19 Chaumont Cir
- 21 Chaumont Cir
- 2 Chaumont Cir Unit 147
- 2 Chaumont Cir
- 4 Chaumont Cir Unit 148
- 6 Chaumont Cir Unit 145
- 8 Chaumont Cir Unit 143
- 10 Chaumont Cir
- 14 Chaumont Cir Unit 144
- 16 Chaumont Cir
- 18 Chaumont Cir
- 20 Chaumont Cir
- 23 Chaumont Cir