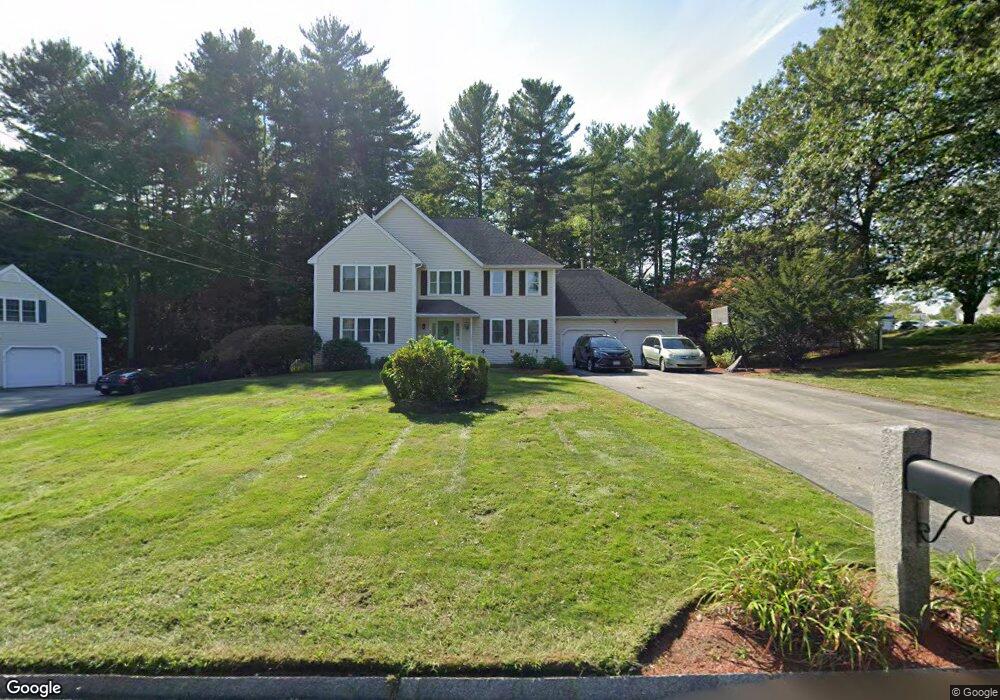
1 Covey Rd Nashua, NH 03062
Southwest Nashua NeighborhoodEstimated Value: $751,917 - $919,000
4
Beds
3
Baths
2,538
Sq Ft
$327/Sq Ft
Est. Value
About This Home
This home is located at 1 Covey Rd, Nashua, NH 03062 and is currently estimated at $829,979, approximately $327 per square foot. 1 Covey Rd is a home located in Hillsborough County with nearby schools including Main Dunstable School, Elm Street Middle School, and Nashua High School South.
Ownership History
Date
Name
Owned For
Owner Type
Purchase Details
Closed on
Aug 16, 2004
Sold by
Murphy Francis P and Murphy Ann M
Bought by
Miris Alexander A and Miris Constantina A
Current Estimated Value
Home Financials for this Owner
Home Financials are based on the most recent Mortgage that was taken out on this home.
Original Mortgage
$125,000
Interest Rate
6.16%
Mortgage Type
Purchase Money Mortgage
Purchase Details
Closed on
Sep 19, 2000
Sold by
Muller Luis A and Muller Cristina M
Bought by
Murphy Francis P and Murphy Ann M
Home Financials for this Owner
Home Financials are based on the most recent Mortgage that was taken out on this home.
Original Mortgage
$252,700
Interest Rate
8.07%
Mortgage Type
Purchase Money Mortgage
Purchase Details
Closed on
May 15, 1998
Sold by
Rodgers Dev Co Inc
Bought by
Muller Luis A and Muller Christina M
Home Financials for this Owner
Home Financials are based on the most recent Mortgage that was taken out on this home.
Original Mortgage
$167,850
Interest Rate
7.08%
Mortgage Type
Purchase Money Mortgage
Create a Home Valuation Report for This Property
The Home Valuation Report is an in-depth analysis detailing your home's value as well as a comparison with similar homes in the area
Home Values in the Area
Average Home Value in this Area
Purchase History
| Date | Buyer | Sale Price | Title Company |
|---|---|---|---|
| Miris Alexander A | $449,900 | -- | |
| Murphy Francis P | $354,900 | -- | |
| Muller Luis A | $237,900 | -- |
Source: Public Records
Mortgage History
| Date | Status | Borrower | Loan Amount |
|---|---|---|---|
| Open | Muller Luis A | $105,000 | |
| Closed | Muller Luis A | $125,000 | |
| Previous Owner | Muller Luis A | $252,700 | |
| Previous Owner | Muller Luis A | $167,850 |
Source: Public Records
Tax History Compared to Growth
Tax History
| Year | Tax Paid | Tax Assessment Tax Assessment Total Assessment is a certain percentage of the fair market value that is determined by local assessors to be the total taxable value of land and additions on the property. | Land | Improvement |
|---|---|---|---|---|
| 2024 | $12,785 | $804,100 | $210,100 | $594,000 |
| 2023 | $11,222 | $615,600 | $116,800 | $498,800 |
| 2022 | $11,124 | $615,600 | $116,800 | $498,800 |
| 2021 | $12,014 | $517,400 | $163,700 | $353,700 |
| 2020 | $11,698 | $517,400 | $163,700 | $353,700 |
| 2019 | $11,259 | $517,400 | $163,700 | $353,700 |
| 2018 | $10,974 | $517,400 | $163,700 | $353,700 |
| 2017 | $10,685 | $414,300 | $149,100 | $265,200 |
| 2016 | $10,387 | $414,300 | $149,100 | $265,200 |
| 2015 | $10,163 | $414,300 | $149,100 | $265,200 |
| 2014 | $9,964 | $414,300 | $149,100 | $265,200 |
Source: Public Records
Map
Nearby Homes
- 5 Doucet Ave
- 1 Doucet Ave
- 3 Doucet Ave Unit The Cub
- 7 Wilderness Dr
- 63 Wilderness Dr Unit Derby 2
- 2 Wilderness Dr
- 61 Wilderness Dr
- 3 Wilderness Dr
- 6 Wilderness Dr
- 59 Wilderness Dr
- 79 Wilderness Dr
- 57 Wilderness Dr
- 41 Pinebrook Rd
- 1 Wilderness Dr
- 4 Wilderness Dr
- 50 Wilderness Dr
- 65 Wilderness Dr
- 58 Wilderness Dr
- 7 Doucet Ave
- 4 Hikers Ln