Estimated Value: $413,536 - $463,000
3
Beds
1
Bath
900
Sq Ft
$493/Sq Ft
Est. Value
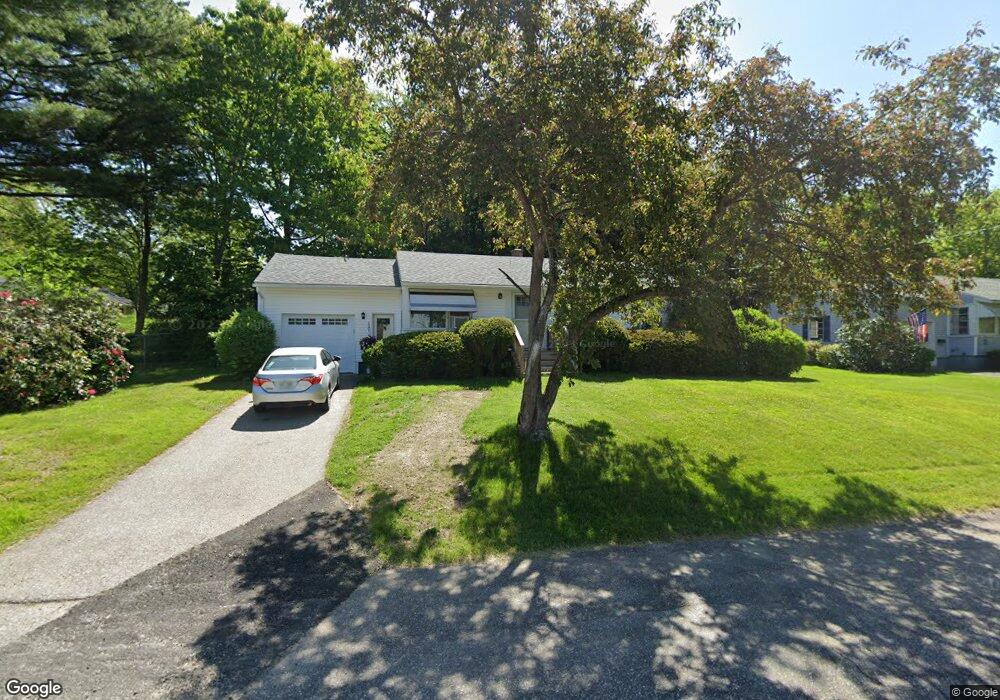
About This Home
This home is located at 1 Danbury Ln, Dover, NH 03820 and is currently estimated at $443,384, approximately $492 per square foot. 1 Danbury Ln is a home located in Strafford County with nearby schools including Horne Street School, Dover Middle School, and Dover Senior High School.
Ownership History
Date
Name
Owned For
Owner Type
Purchase Details
Closed on
Sep 6, 2017
Sold by
Soucy David R and Soucy Sandi K
Bought by
David David R and David S T
Current Estimated Value
Purchase Details
Closed on
Jun 29, 2007
Sold by
Turgeon Paula A and Turgeon Edmond
Bought by
Soucy David R and Soucy Sandi K
Home Financials for this Owner
Home Financials are based on the most recent Mortgage that was taken out on this home.
Original Mortgage
$208,905
Interest Rate
6.24%
Mortgage Type
Purchase Money Mortgage
Purchase Details
Closed on
Jun 25, 2004
Sold by
Dillon Jeannette L Est
Bought by
Turgeon Edmond and Turgeon Paula A
Home Financials for this Owner
Home Financials are based on the most recent Mortgage that was taken out on this home.
Original Mortgage
$156,000
Interest Rate
6.32%
Mortgage Type
Purchase Money Mortgage
Create a Home Valuation Report for This Property
The Home Valuation Report is an in-depth analysis detailing your home's value as well as a comparison with similar homes in the area
Home Values in the Area
Average Home Value in this Area
Purchase History
| Date | Buyer | Sale Price | Title Company |
|---|---|---|---|
| David David R | -- | -- | |
| Soucy David R | $219,900 | -- | |
| Turgeon Edmond | $195,000 | -- |
Source: Public Records
Mortgage History
| Date | Status | Borrower | Loan Amount |
|---|---|---|---|
| Previous Owner | Turgeon Edmond | $208,905 | |
| Previous Owner | Turgeon Edmond | $156,000 |
Source: Public Records
Tax History
| Year | Tax Paid | Tax Assessment Tax Assessment Total Assessment is a certain percentage of the fair market value that is determined by local assessors to be the total taxable value of land and additions on the property. | Land | Improvement |
|---|---|---|---|---|
| 2024 | $6,572 | $361,700 | $173,300 | $188,400 |
| 2023 | $5,741 | $307,000 | $149,600 | $157,400 |
| 2022 | $5,629 | $283,700 | $141,800 | $141,900 |
| 2021 | $5,581 | $257,200 | $133,900 | $123,300 |
| 2020 | $5,233 | $210,600 | $110,300 | $100,300 |
| 2019 | $4,955 | $196,700 | $98,400 | $98,300 |
| 2018 | $4,986 | $200,100 | $106,300 | $93,800 |
| 2017 | $4,701 | $181,700 | $90,600 | $91,100 |
| 2016 | $4,335 | $164,900 | $82,000 | $82,900 |
| 2015 | $4,226 | $158,800 | $77,900 | $80,900 |
| 2014 | $4,130 | $158,800 | $77,900 | $80,900 |
| 2011 | $3,848 | $153,200 | $72,500 | $80,700 |
Source: Public Records
Map
Nearby Homes
- 226 Oak St
- 3 Cocheco St
- Lot 3 Enclave Unit 13F-2
- Lot 2 Emerson Ridge Unit 2
- Lot 1 Emerson Ridge Unit 1
- Lot 6 Emerson Ridge Unit 6
- 46-50 Cocheco St
- 11 Country Club Estates Dr Unit 11
- 36 Little Bay Dr
- 22 Little Bay Dr
- 24 Little Bay Dr
- 47 Central Ave
- 88 Cricketbrook
- 93 Henry Law Ave Unit 74
- 34 Floral Ave Unit 5
- 51 Childs Dr
- 11 Frances Dr
- 43 Sixth St Unit A and B
- 725 Central Ave Unit 203
- 725 Central Ave Unit LL03
- 3 Danbury Ln
- 25 Atlantic Ave
- 23 Atlantic Ave
- 0 Atlantic Ave
- 5 Danbury Ln
- 7 Deer Creek Run
- 4 Danbury Ln
- 29 Atlantic Ave
- 21 Atlantic Ave
- 5 Deer Creek Run
- 26 Atlantic Ave
- 31 Atlantic Ave
- 28 Atlantic Ave
- 26A Atlantic Ave
- 1 Cross St
- 28 Atlantic Ave
- 30 Atlantic Ave
- 20 Atlantic Ave
- 32 Atlantic Ave
- 5 Fairview Ave
Your Personal Tour Guide
Ask me questions while you tour the home.