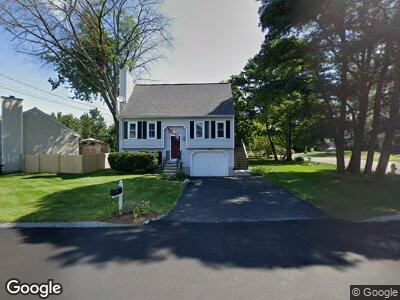
1 Delta Dr Nashua, NH 03060
South End Nashua NeighborhoodEstimated Value: $479,000 - $522,000
3
Beds
1
Bath
1,397
Sq Ft
$360/Sq Ft
Est. Value
About This Home
This home is located at 1 Delta Dr, Nashua, NH 03060 and is currently estimated at $502,640, approximately $359 per square foot. 1 Delta Dr is a home located in Hillsborough County with nearby schools including Sunset Heights Elementary School, Elm Street Middle School, and Nashua High School North.
Ownership History
Date
Name
Owned For
Owner Type
Purchase Details
Closed on
Jun 20, 2023
Sold by
Donnell Barbara A
Bought by
1St B A Donnelly Ft and Donnell
Current Estimated Value
Home Financials for this Owner
Home Financials are based on the most recent Mortgage that was taken out on this home.
Original Mortgage
$10,000
Outstanding Balance
$9,861
Interest Rate
6.57%
Mortgage Type
Stand Alone Refi Refinance Of Original Loan
Purchase Details
Closed on
Jun 3, 1992
Bought by
Donnelly Brian M and Donnelly Barbara A
Create a Home Valuation Report for This Property
The Home Valuation Report is an in-depth analysis detailing your home's value as well as a comparison with similar homes in the area
Home Values in the Area
Average Home Value in this Area
Purchase History
| Date | Buyer | Sale Price | Title Company |
|---|---|---|---|
| 1St B A Donnelly Ft | -- | None Available | |
| 1St B A Donnelly Ft | -- | None Available | |
| Donnelly Brian M | $127,000 | -- |
Source: Public Records
Mortgage History
| Date | Status | Borrower | Loan Amount |
|---|---|---|---|
| Open | 1St B A Donnelly Ft | $10,000 | |
| Closed | 1St B A Donnelly Ft | $10,000 | |
| Previous Owner | Donnelly Brian M | $50,000 |
Source: Public Records
Tax History Compared to Growth
Tax History
| Year | Tax Paid | Tax Assessment Tax Assessment Total Assessment is a certain percentage of the fair market value that is determined by local assessors to be the total taxable value of land and additions on the property. | Land | Improvement |
|---|---|---|---|---|
| 2023 | $7,635 | $418,800 | $123,700 | $295,100 |
| 2022 | $7,568 | $418,800 | $123,700 | $295,100 |
| 2021 | $6,889 | $296,700 | $86,600 | $210,100 |
| 2020 | $6,708 | $296,700 | $86,600 | $210,100 |
| 2019 | $6,456 | $296,700 | $86,600 | $210,100 |
| 2018 | $6,293 | $296,700 | $86,600 | $210,100 |
| 2017 | $5,594 | $216,900 | $77,900 | $139,000 |
| 2016 | $5,438 | $216,900 | $77,900 | $139,000 |
| 2015 | $5,321 | $216,900 | $77,900 | $139,000 |
| 2014 | $5,216 | $216,900 | $77,900 | $139,000 |
Source: Public Records
Map
Nearby Homes