Estimated Value: $711,000 - $923,000
3
Beds
2
Baths
1,311
Sq Ft
$623/Sq Ft
Est. Value
About This Home
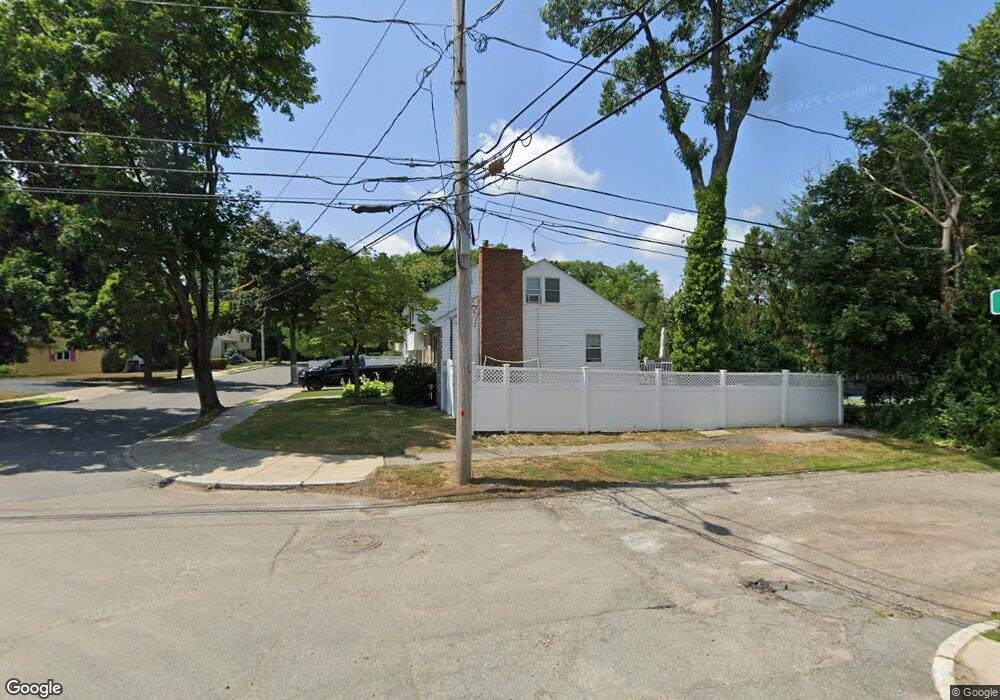
This home is located at 1 Deroma Rd, West Roxbury, MA 02132 and is currently estimated at $816,960, approximately $623 per square foot. 1 Deroma Rd is a home located in Suffolk County with nearby schools including St Theresa School, The Roxbury Latin School, and Catholic Memorial School.
Ownership History
Date
Name
Owned For
Owner Type
Purchase Details
Closed on
Dec 26, 2017
Sold by
Holbrook Mark D and Holbrook Elhamm
Bought by
Holbrook Elhamm
Current Estimated Value
Purchase Details
Closed on
Apr 20, 2012
Sold by
Williams George and Williams Rita E
Bought by
Holbrook Mark D and Holbrook Elhamm
Home Financials for this Owner
Home Financials are based on the most recent Mortgage that was taken out on this home.
Original Mortgage
$318,250
Interest Rate
3.89%
Mortgage Type
New Conventional
Purchase Details
Closed on
May 13, 1994
Sold by
Dacey Elizabeth F
Bought by
Williams George and Williams Rita E
Create a Home Valuation Report for This Property
The Home Valuation Report is an in-depth analysis detailing your home's value as well as a comparison with similar homes in the area
Home Values in the Area
Average Home Value in this Area
Purchase History
| Date | Buyer | Sale Price | Title Company |
|---|---|---|---|
| Holbrook Elhamm | -- | -- | |
| Holbrook Mark D | $335,500 | -- | |
| Williams George | $187,000 | -- |
Source: Public Records
Mortgage History
| Date | Status | Borrower | Loan Amount |
|---|---|---|---|
| Previous Owner | Holbrook Mark D | $318,250 |
Source: Public Records
Tax History Compared to Growth
Tax History
| Year | Tax Paid | Tax Assessment Tax Assessment Total Assessment is a certain percentage of the fair market value that is determined by local assessors to be the total taxable value of land and additions on the property. | Land | Improvement |
|---|---|---|---|---|
| 2025 | $8,232 | $710,900 | $228,000 | $482,900 |
| 2024 | $7,230 | $663,300 | $233,200 | $430,100 |
| 2023 | $6,720 | $625,700 | $220,000 | $405,700 |
| 2022 | $6,190 | $568,900 | $200,000 | $368,900 |
| 2021 | $5,777 | $541,400 | $194,200 | $347,200 |
| 2020 | $5,219 | $494,200 | $178,700 | $315,500 |
| 2019 | $4,618 | $438,100 | $148,400 | $289,700 |
| 2018 | $4,371 | $417,100 | $148,400 | $268,700 |
| 2017 | $4,372 | $412,800 | $148,400 | $264,400 |
| 2016 | $4,283 | $389,400 | $148,400 | $241,000 |
| 2015 | $4,745 | $391,800 | $167,300 | $224,500 |
| 2014 | $4,602 | $365,800 | $167,300 | $198,500 |
Source: Public Records
Map
Nearby Homes
- 145 Lagrange St
- 12 Eagle St
- 12 Loyola Cir
- 275 Bellevue St
- 50 Heron St
- 35 Heron St
- 73 Woodard Rd
- 14 Starling St
- 348 Lagrange St
- 54 Sturges Rd
- 10 Starling St
- 4873 Washington St Unit 1
- 2231 Centre St
- 2 Lagrange St Unit 4
- 4959 Washington St
- 12 Bronx Rd
- 4975 Washington St Unit 306
- 4975 Washington St Unit 311
- 27-29 Temple St
- 425 Lagrange St Unit 203