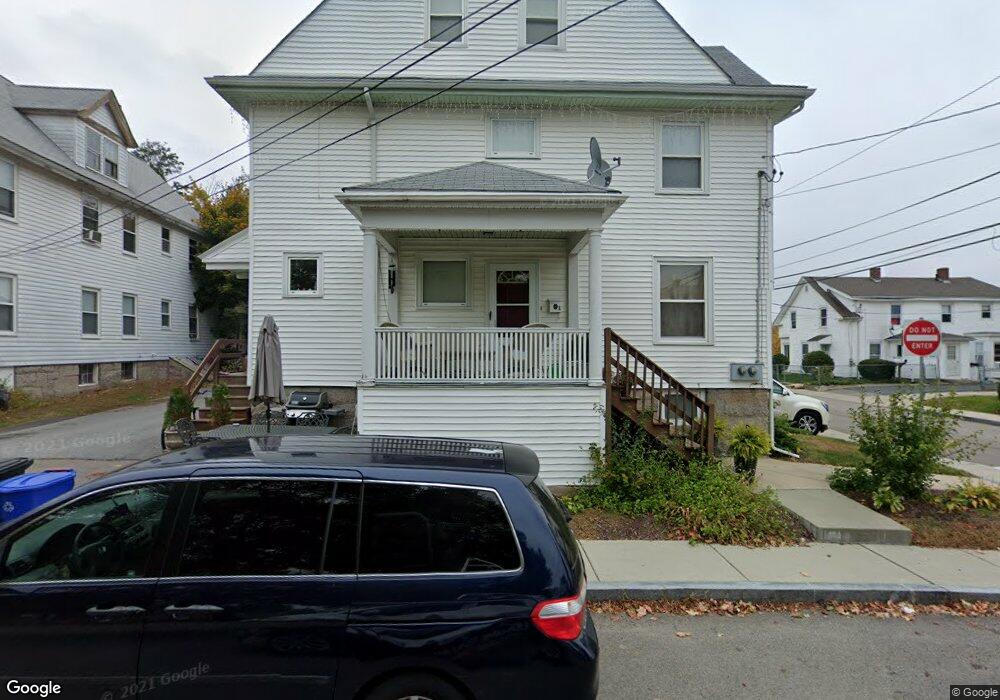
1 Draper Park Milford, MA 01757
Estimated Value: $586,812 - $674,000
7
Beds
4
Baths
3,180
Sq Ft
$197/Sq Ft
Est. Value
About This Home
This home is located at 1 Draper Park, Milford, MA 01757 and is currently estimated at $626,953, approximately $197 per square foot. 1 Draper Park is a home located in Worcester County with nearby schools including Milford High School and Bethany Christian Academy.
Ownership History
Date
Name
Owned For
Owner Type
Purchase Details
Closed on
Oct 22, 2021
Sold by
Goncalves Daniel S and Goncalves Judite M
Bought by
Goncalves Paulo A
Current Estimated Value
Purchase Details
Closed on
Mar 31, 2000
Sold by
Nationscredit Fincl Sv
Bought by
Goncalves Daniel S and Goncalves Judite M
Purchase Details
Closed on
Dec 8, 1997
Sold by
Ramos Salustiano
Bought by
Chrysler First Fincl
Create a Home Valuation Report for This Property
The Home Valuation Report is an in-depth analysis detailing your home's value as well as a comparison with similar homes in the area
Home Values in the Area
Average Home Value in this Area
Purchase History
| Date | Buyer | Sale Price | Title Company |
|---|---|---|---|
| Goncalves Paulo A | -- | None Available | |
| Goncalves Daniel S | $72,000 | -- | |
| Nationscredit Fincl Sv | $62,302 | -- | |
| Chrysler First Fincl | $62,302 | -- |
Source: Public Records
Mortgage History
| Date | Status | Borrower | Loan Amount |
|---|---|---|---|
| Previous Owner | Chrysler First Fincl | $38,523 | |
| Previous Owner | Chrysler First Fincl | $27,138 |
Source: Public Records
Tax History Compared to Growth
Tax History
| Year | Tax Paid | Tax Assessment Tax Assessment Total Assessment is a certain percentage of the fair market value that is determined by local assessors to be the total taxable value of land and additions on the property. | Land | Improvement |
|---|---|---|---|---|
| 2025 | $6,867 | $536,500 | $148,200 | $388,300 |
| 2024 | $6,680 | $502,600 | $141,300 | $361,300 |
| 2023 | $6,128 | $424,100 | $118,900 | $305,200 |
| 2022 | $5,947 | $386,400 | $108,600 | $277,800 |
| 2021 | $5,567 | $348,400 | $108,600 | $239,800 |
| 2020 | $5,426 | $340,000 | $108,600 | $231,400 |
| 2019 | $4,858 | $293,700 | $108,600 | $185,100 |
| 2018 | $4,377 | $264,300 | $103,400 | $160,900 |
| 2017 | $4,219 | $251,300 | $103,400 | $147,900 |
| 2016 | $4,139 | $240,900 | $93,000 | $147,900 |
| 2015 | $4,037 | $230,000 | $89,600 | $140,400 |
Source: Public Records
Map
Nearby Homes