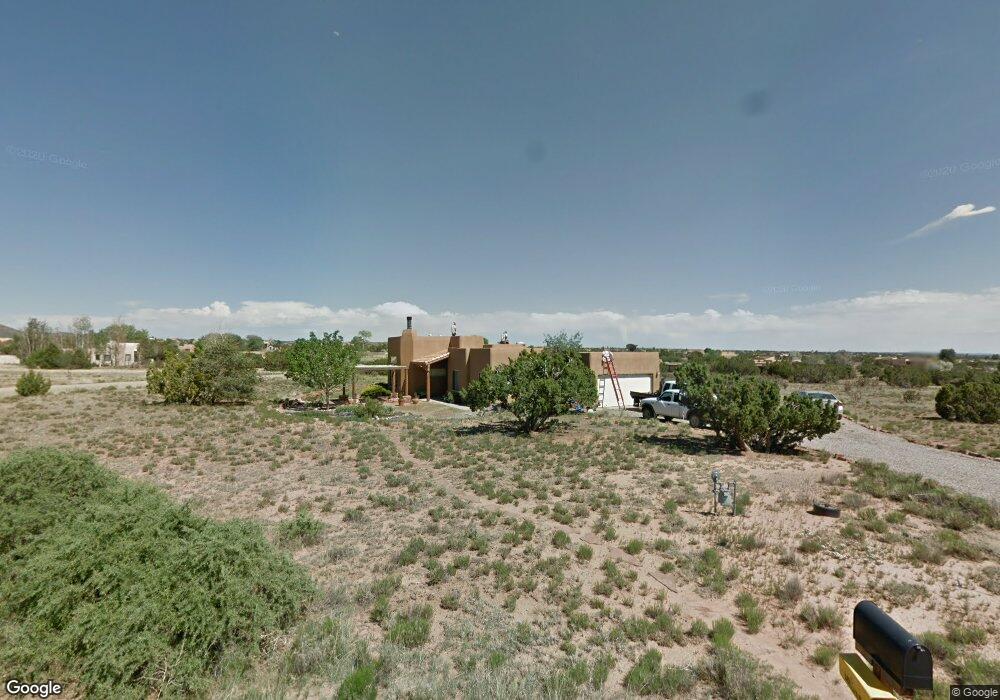
1 Esquila Rd Santa Fe, NM 87508
Eldorado at Santa Fe NeighborhoodEstimated Value: $580,000 - $633,000
3
Beds
2
Baths
1,450
Sq Ft
$417/Sq Ft
Est. Value
About This Home
This home is located at 1 Esquila Rd, Santa Fe, NM 87508 and is currently estimated at $605,142, approximately $417 per square foot. 1 Esquila Rd is a home located in Santa Fe County with nearby schools including El Dorado Community School and Santa Fe High School.
Ownership History
Date
Name
Owned For
Owner Type
Purchase Details
Closed on
Mar 26, 2025
Sold by
Appelgate Roger A and Gerratt Rochelle S
Bought by
Appelgate Gerratt Living Trust and Appelgate
Current Estimated Value
Purchase Details
Closed on
Jun 16, 2017
Sold by
Sweetland Patricia M
Bought by
Appelgate Roger A and Gerratt Rochelle S
Home Financials for this Owner
Home Financials are based on the most recent Mortgage that was taken out on this home.
Original Mortgage
$200,000
Interest Rate
4.02%
Mortgage Type
New Conventional
Purchase Details
Closed on
Aug 27, 1999
Sold by
Quality Concepts Inc
Bought by
Sweetland John P and Sweetland Patricia M
Home Financials for this Owner
Home Financials are based on the most recent Mortgage that was taken out on this home.
Original Mortgage
$166,520
Interest Rate
7.58%
Purchase Details
Closed on
Sep 1, 1998
Sold by
Mckee John Douglas
Bought by
Beltran Heraclio B and Beltran Placida
Create a Home Valuation Report for This Property
The Home Valuation Report is an in-depth analysis detailing your home's value as well as a comparison with similar homes in the area
Home Values in the Area
Average Home Value in this Area
Purchase History
| Date | Buyer | Sale Price | Title Company |
|---|---|---|---|
| Appelgate Gerratt Living Trust | -- | None Listed On Document | |
| Appelgate Roger A | -- | None Available | |
| Sweetland John P | -- | -- | |
| Quality Concepts Inc | -- | -- | |
| Beltran Heraclio B | -- | -- |
Source: Public Records
Mortgage History
| Date | Status | Borrower | Loan Amount |
|---|---|---|---|
| Previous Owner | Appelgate Roger A | $200,000 | |
| Previous Owner | Sweetland John P | $166,520 |
Source: Public Records
Tax History
| Year | Tax Paid | Tax Assessment Tax Assessment Total Assessment is a certain percentage of the fair market value that is determined by local assessors to be the total taxable value of land and additions on the property. | Land | Improvement |
|---|---|---|---|---|
| 2025 | $2,816 | $373,713 | $78,133 | $295,580 |
| 2024 | $2,903 | $362,829 | $75,858 | $286,971 |
| 2023 | $2,901 | $352,262 | $73,649 | $278,613 |
| 2022 | $2,729 | $342,003 | $71,504 | $270,499 |
| 2021 | $2,691 | $110,681 | $23,140 | $87,541 |
| 2020 | $2,639 | $107,457 | $22,466 | $84,991 |
| 2019 | $2,610 | $105,597 | $22,466 | $83,131 |
| 2018 | $2,548 | $102,522 | $22,466 | $80,056 |
| 2017 | $1,791 | $73,700 | $22,466 | $51,234 |
| 2016 | $1,675 | $71,554 | $28,770 | $42,784 |
| 2015 | $1,650 | $69,470 | $28,770 | $40,700 |
| 2014 | $1,678 | $74,952 | $28,741 | $46,210 |
Source: Public Records
Map
Nearby Homes
Your Personal Tour Guide
Ask me questions while you tour the home.