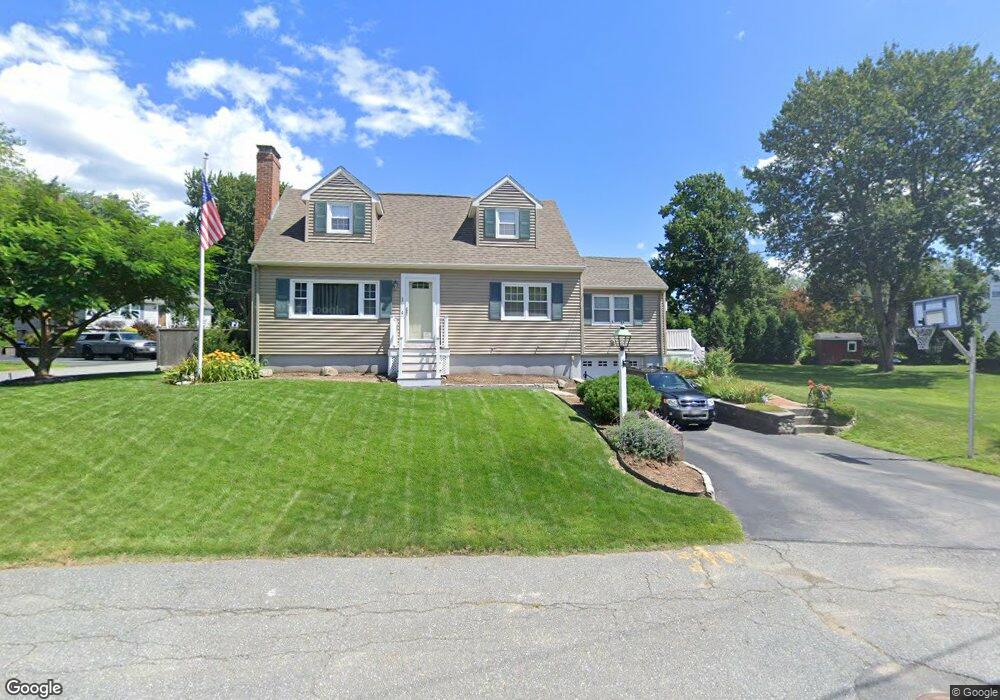
1 Freeport Ave Methuen, MA 01844
The West End NeighborhoodEstimated Value: $582,112 - $642,000
3
Beds
2
Baths
1,638
Sq Ft
$381/Sq Ft
Est. Value
About This Home
This home is located at 1 Freeport Ave, Methuen, MA 01844 and is currently estimated at $624,278, approximately $381 per square foot. 1 Freeport Ave is a home located in Essex County with nearby schools including Marsh Grammar School, Methuen High School, and Lawrence Family Development Charter School.
Ownership History
Date
Name
Owned For
Owner Type
Purchase Details
Closed on
Sep 10, 2010
Sold by
Downer Tr Susan M and Stewart Joan M
Bought by
Stewart Steven M and Stewart Colleen
Current Estimated Value
Home Financials for this Owner
Home Financials are based on the most recent Mortgage that was taken out on this home.
Original Mortgage
$266,412
Outstanding Balance
$173,909
Interest Rate
4.37%
Mortgage Type
FHA
Estimated Equity
$450,369
Purchase Details
Closed on
Aug 17, 2007
Sold by
Stewart Donald E and Stewart Joan M
Bought by
Stewart Tr Donald E and Stewart Joan M
Create a Home Valuation Report for This Property
The Home Valuation Report is an in-depth analysis detailing your home's value as well as a comparison with similar homes in the area
Home Values in the Area
Average Home Value in this Area
Purchase History
| Date | Buyer | Sale Price | Title Company |
|---|---|---|---|
| Stewart Steven M | $270,000 | -- | |
| Stewart Steven M | $270,000 | -- | |
| Stewart Tr Donald E | -- | -- | |
| Stewart Tr Donald E | -- | -- |
Source: Public Records
Mortgage History
| Date | Status | Borrower | Loan Amount |
|---|---|---|---|
| Open | Stewart Steven M | $266,412 | |
| Closed | Stewart Tr Donald E | $266,412 | |
| Previous Owner | Stewart Tr Donald E | $50,000 |
Source: Public Records
Tax History
| Year | Tax Paid | Tax Assessment Tax Assessment Total Assessment is a certain percentage of the fair market value that is determined by local assessors to be the total taxable value of land and additions on the property. | Land | Improvement |
|---|---|---|---|---|
| 2025 | $5,605 | $529,800 | $218,800 | $311,000 |
| 2024 | $5,539 | $510,000 | $198,900 | $311,100 |
| 2023 | $5,169 | $441,800 | $177,600 | $264,200 |
| 2022 | $4,823 | $369,600 | $142,000 | $227,600 |
| 2021 | $4,587 | $347,800 | $134,900 | $212,900 |
| 2020 | $4,596 | $342,000 | $134,900 | $207,100 |
| 2019 | $4,466 | $314,700 | $127,800 | $186,900 |
| 2018 | $4,367 | $306,000 | $127,800 | $178,200 |
| 2017 | $4,225 | $288,400 | $127,800 | $160,600 |
| 2016 | $4,016 | $271,200 | $127,800 | $143,400 |
| 2015 | $3,771 | $258,300 | $127,800 | $130,500 |
Source: Public Records
Map
Nearby Homes
Your Personal Tour Guide
Ask me questions while you tour the home.