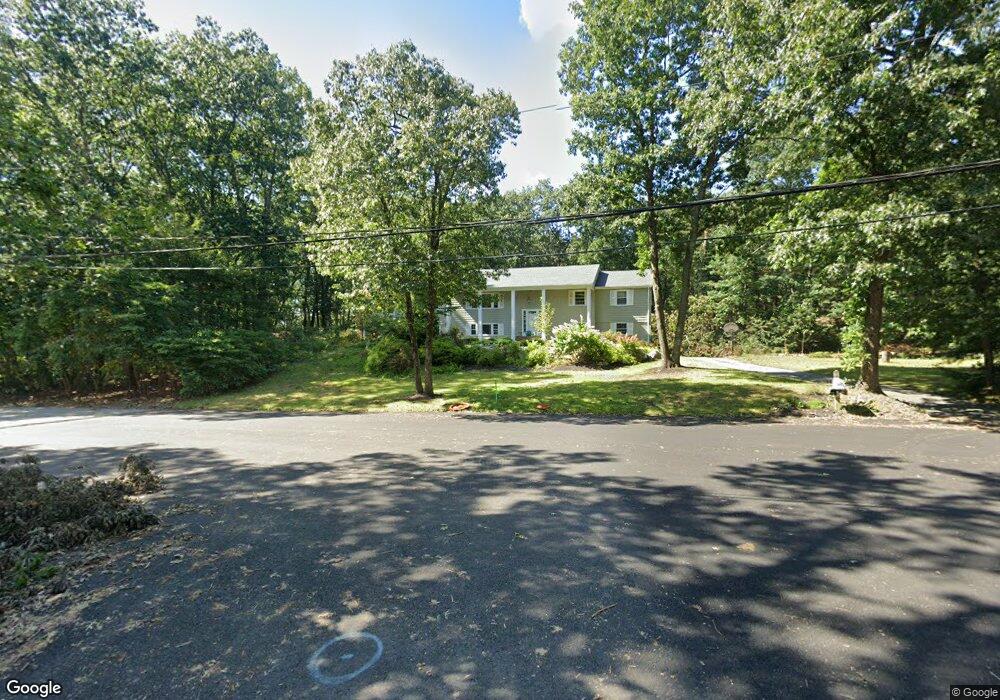
1 Glenwood Rd Andover, MA 01810
Estimated Value: $1,103,456 - $1,263,000
4
Beds
3
Baths
2,959
Sq Ft
$401/Sq Ft
Est. Value
About This Home
This home is located at 1 Glenwood Rd, Andover, MA 01810 and is currently estimated at $1,185,114, approximately $400 per square foot. 1 Glenwood Rd is a home located in Essex County with nearby schools including South Elementary School, Doherty Middle School, and Andover High School.
Ownership History
Date
Name
Owned For
Owner Type
Purchase Details
Closed on
Dec 14, 1999
Sold by
Frongello Robert J and Frongello Kathryn M
Bought by
Penamatsa Vidya and Penamatsa Millik
Current Estimated Value
Home Financials for this Owner
Home Financials are based on the most recent Mortgage that was taken out on this home.
Original Mortgage
$300,000
Interest Rate
7.9%
Mortgage Type
Purchase Money Mortgage
Purchase Details
Closed on
Jun 17, 1996
Sold by
S&M Rt
Bought by
Garesche Thomas M
Purchase Details
Closed on
Nov 29, 1995
Sold by
Geaghan Bernard
Bought by
Frongello Robert J
Purchase Details
Closed on
Aug 4, 1995
Sold by
Gre T
Bought by
S&M Rt
Purchase Details
Closed on
Oct 15, 1991
Sold by
Salem St Rt
Bought by
Gre Trust
Create a Home Valuation Report for This Property
The Home Valuation Report is an in-depth analysis detailing your home's value as well as a comparison with similar homes in the area
Home Values in the Area
Average Home Value in this Area
Purchase History
| Date | Buyer | Sale Price | Title Company |
|---|---|---|---|
| Penamatsa Vidya | $384,000 | -- | |
| Garesche Thomas M | $292,000 | -- | |
| Frongello Robert J | $262,500 | -- | |
| S&M Rt | $98,500 | -- | |
| Gre Trust | $20,000 | -- |
Source: Public Records
Mortgage History
| Date | Status | Borrower | Loan Amount |
|---|---|---|---|
| Open | Gre Trust | $300,000 | |
| Closed | Gre Trust | $75,000 | |
| Closed | Penamatsa Vidya | $300,000 |
Source: Public Records
Tax History Compared to Growth
Tax History
| Year | Tax Paid | Tax Assessment Tax Assessment Total Assessment is a certain percentage of the fair market value that is determined by local assessors to be the total taxable value of land and additions on the property. | Land | Improvement |
|---|---|---|---|---|
| 2024 | $11,055 | $858,300 | $509,800 | $348,500 |
| 2023 | $10,682 | $782,000 | $459,300 | $322,700 |
| 2022 | $9,807 | $671,700 | $399,600 | $272,100 |
| 2021 | $9,387 | $613,900 | $363,500 | $250,400 |
| 2020 | $9,004 | $599,900 | $354,800 | $245,100 |
| 2019 | $8,907 | $583,300 | $344,300 | $239,000 |
| 2018 | $8,625 | $551,500 | $331,200 | $220,300 |
| 2017 | $8,246 | $543,200 | $324,700 | $218,500 |
| 2016 | $8,050 | $543,200 | $324,700 | $218,500 |
| 2015 | $7,789 | $520,300 | $312,100 | $208,200 |
Source: Public Records
Map
Nearby Homes
- 2 Clover Cir
- 18 Boston Rd
- 17 Linda Rd
- 21 Rocky Hill Rd
- 11 Gould Rd
- 40 Ballardvale Rd
- 24 Enfield Dr
- 40 Colonial Dr Unit 8
- 56 Sunset Rock Rd
- 20 Colonial Dr Unit 3
- 1 Colonial Dr Unit C1-6
- 1 Colonial Dr Unit B1-8
- 9 Flash Rd
- 331 S Main St
- 3 West Hollow
- 25 Timothy Dr
- 10 Hillside Rd
- 11 Cogswell Rd
- 2 Tamys Ln
- 50 Hidden Rd
- 51 County Rd
- 3 Glenwood Rd
- 60 Rattlesnake Hill Rd
- 66 County Rd
- 4 Hawk Ridge Rd
- 64 Rattlesnake Hill Rd
- 4 Glenwood Rd
- 1 Sleepy Hollow Ln
- 47 County Rd
- 52 Rattlesnake Hill Rd
- 3 Sleepy Hollow Ln
- 55 Rattlesnake Hill Rd
- 59 Rattlesnake Hill Rd
- 45 County Rd
- 63 Rattlesnake Hill Rd
- 43 County Rd
- 5 Hawk Ridge Rd
- 51 Rattlesnake Hill Rd
- 5 Sleepy Hollow Ln
- 67 Rattlesnake Hill Rd