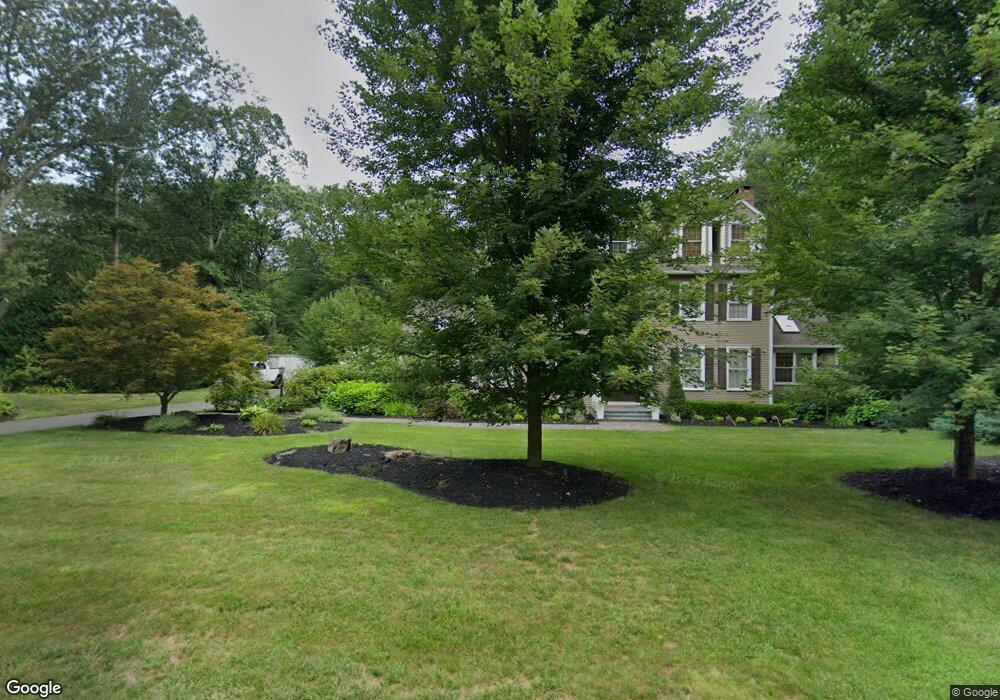
1 Jeffs Ln Canton, CT 06019
Estimated Value: $858,000 - $978,000
5
Beds
4
Baths
3,865
Sq Ft
$236/Sq Ft
Est. Value
About This Home
This home is located at 1 Jeffs Ln, Canton, CT 06019 and is currently estimated at $910,242, approximately $235 per square foot. 1 Jeffs Ln is a home located in Hartford County with nearby schools including Cherry Brook Primary School, Canton Intermediate School, and Canton Middle School.
Ownership History
Date
Name
Owned For
Owner Type
Purchase Details
Closed on
Feb 26, 2014
Sold by
Lee Russell S and Lee Charisse
Bought by
Eisenbaum Jason B
Current Estimated Value
Home Financials for this Owner
Home Financials are based on the most recent Mortgage that was taken out on this home.
Original Mortgage
$416,000
Outstanding Balance
$315,911
Interest Rate
4.39%
Mortgage Type
New Conventional
Estimated Equity
$594,331
Purchase Details
Closed on
Dec 22, 2010
Sold by
Dibella Lucille M and Dibella Thomas J
Bought by
Lee Charisse and Lee Russell S
Home Financials for this Owner
Home Financials are based on the most recent Mortgage that was taken out on this home.
Original Mortgage
$439,500
Interest Rate
4.17%
Purchase Details
Closed on
Oct 4, 1991
Sold by
Conn Natl Bk
Bought by
Dibella Thomas and Tagliamonte Lucille
Create a Home Valuation Report for This Property
The Home Valuation Report is an in-depth analysis detailing your home's value as well as a comparison with similar homes in the area
Home Values in the Area
Average Home Value in this Area
Purchase History
| Date | Buyer | Sale Price | Title Company |
|---|---|---|---|
| Eisenbaum Jason B | $520,000 | -- | |
| Eisenbaum Jason B | $520,000 | -- | |
| Lee Charisse | $495,000 | -- | |
| Lee Charisse | $495,000 | -- | |
| Dibella Thomas | $200,000 | -- |
Source: Public Records
Mortgage History
| Date | Status | Borrower | Loan Amount |
|---|---|---|---|
| Open | Dibella Thomas | $416,000 | |
| Closed | Dibella Thomas | $416,000 | |
| Previous Owner | Dibella Thomas | $439,500 |
Source: Public Records
Tax History
| Year | Tax Paid | Tax Assessment Tax Assessment Total Assessment is a certain percentage of the fair market value that is determined by local assessors to be the total taxable value of land and additions on the property. | Land | Improvement |
|---|---|---|---|---|
| 2025 | $16,635 | $496,580 | $105,810 | $390,770 |
| 2024 | $16,958 | $496,580 | $105,810 | $390,770 |
| 2023 | $11,865 | $335,440 | $101,080 | $234,360 |
| 2022 | $11,301 | $335,440 | $101,080 | $234,360 |
| 2021 | $11,143 | $335,440 | $101,080 | $234,360 |
| 2020 | $10,932 | $335,440 | $101,080 | $234,360 |
| 2019 | $10,744 | $335,440 | $101,080 | $234,360 |
| 2018 | $11,734 | $382,210 | $105,980 | $276,230 |
| 2017 | $11,654 | $382,210 | $105,980 | $276,230 |
| 2016 | $11,375 | $382,210 | $105,980 | $276,230 |
| 2015 | $11,157 | $382,210 | $105,980 | $276,230 |
| 2014 | $10,916 | $382,220 | $105,990 | $276,230 |
Source: Public Records
Map
Nearby Homes
- 29 Lovely St
- 28 Meadowview Ct Unit 28
- 21 Lakeview Blvd
- 26 Forest Ln
- 30 Cliff Dr
- 49 Applegate Ln Unit 49
- 110 Windsor Ct
- 102 Cold Spring Rd
- 48 Weatherstone
- 61 Weatherstone
- 58 Weatherstone
- 3 Clearwater Ct
- 35 Dyer Ave
- 70 E Hill Rd
- 706 Timber Ln Unit 706
- 187 W Avon Rd
- Lots 1-3 Verville Rd
- 138 Northington Dr
- 13 Woodland Dr
- 134 Old Mill Rd
Your Personal Tour Guide
Ask me questions while you tour the home.