1 John St Londonderry, NH 03053
Estimated Value: $561,105 - $611,000
3
Beds
2
Baths
1,685
Sq Ft
$344/Sq Ft
Est. Value
About This Home
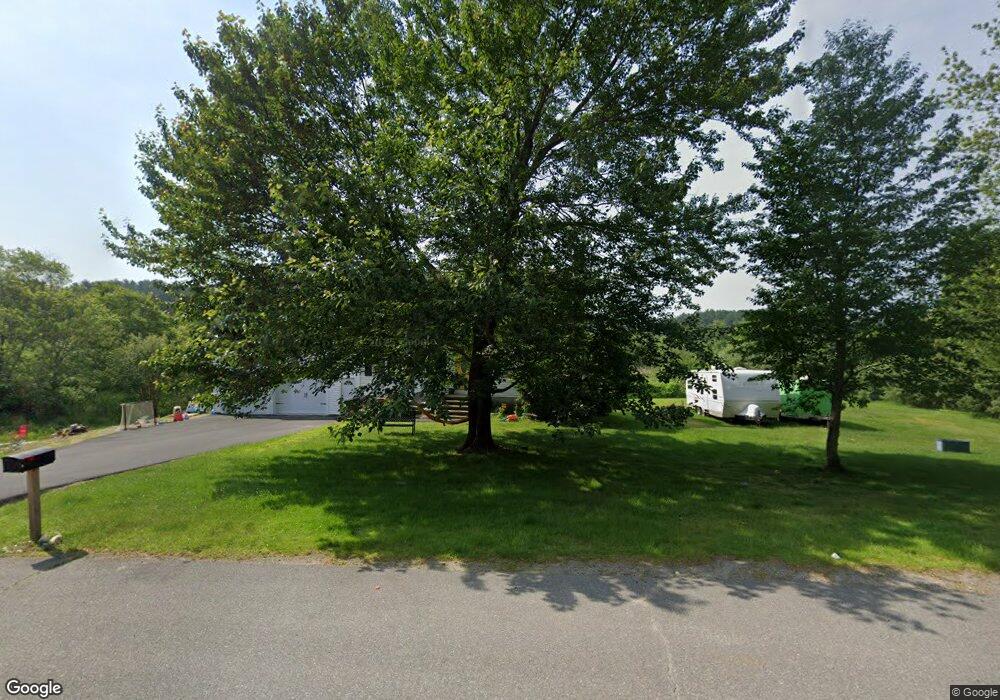
This home is located at 1 John St, Londonderry, NH 03053 and is currently estimated at $579,776, approximately $344 per square foot. 1 John St is a home located in Rockingham County with nearby schools including Londonderry Middle School, Londonderry Senior High School, and Tabernacle Christian School.
Ownership History
Date
Name
Owned For
Owner Type
Purchase Details
Closed on
Aug 20, 2021
Sold by
Pilalas Katherine
Bought by
Pilalas Christopher S and Pilalas Katherine
Current Estimated Value
Home Financials for this Owner
Home Financials are based on the most recent Mortgage that was taken out on this home.
Original Mortgage
$262,000
Outstanding Balance
$239,954
Interest Rate
2.8%
Mortgage Type
New Conventional
Estimated Equity
$339,822
Purchase Details
Closed on
Dec 1, 2014
Sold by
Okeefe Ryan S
Bought by
Pilalas Katherine
Purchase Details
Closed on
Nov 20, 2008
Sold by
Us Bank Na
Bought by
Okeefe Ryan S
Home Financials for this Owner
Home Financials are based on the most recent Mortgage that was taken out on this home.
Original Mortgage
$132,000
Interest Rate
6.03%
Purchase Details
Closed on
May 8, 2008
Sold by
Holland Eugene F
Bought by
Us Bank Na
Purchase Details
Closed on
Feb 3, 1997
Sold by
Jones Douglas A and Jones Susan L
Bought by
Holland Eugene F and Holland Lynne A
Create a Home Valuation Report for This Property
The Home Valuation Report is an in-depth analysis detailing your home's value as well as a comparison with similar homes in the area
Home Values in the Area
Average Home Value in this Area
Purchase History
| Date | Buyer | Sale Price | Title Company |
|---|---|---|---|
| Pilalas Christopher S | -- | None Available | |
| Pilalas Christopher S | -- | None Available | |
| Pilalas Christopher S | -- | None Available | |
| Pilalas Katherine | $230,000 | -- | |
| Okeefe Ryan S | $165,000 | -- | |
| Us Bank Na | $217,800 | -- | |
| Holland Eugene F | $95,000 | -- | |
| Pilalas Katherine | $230,000 | -- | |
| Us Bank Na | $217,800 | -- | |
| Holland Eugene F | $95,000 | -- |
Source: Public Records
Mortgage History
| Date | Status | Borrower | Loan Amount |
|---|---|---|---|
| Open | Pilalas Christopher S | $262,000 | |
| Closed | Pilalas Christopher S | $262,000 | |
| Previous Owner | Holland Eugene F | $156,600 | |
| Previous Owner | Holland Eugene F | $132,000 |
Source: Public Records
Tax History Compared to Growth
Tax History
| Year | Tax Paid | Tax Assessment Tax Assessment Total Assessment is a certain percentage of the fair market value that is determined by local assessors to be the total taxable value of land and additions on the property. | Land | Improvement |
|---|---|---|---|---|
| 2024 | $7,784 | $482,300 | $202,100 | $280,200 |
| 2023 | $7,182 | $458,900 | $202,100 | $256,800 |
| 2022 | $6,610 | $357,700 | $151,600 | $206,100 |
| 2021 | $6,575 | $357,700 | $151,600 | $206,100 |
| 2020 | $6,172 | $306,900 | $122,200 | $184,700 |
| 2019 | $5,951 | $306,900 | $122,200 | $184,700 |
| 2018 | $5,522 | $253,300 | $101,300 | $152,000 |
| 2017 | $5,474 | $253,300 | $101,300 | $152,000 |
| 2016 | $5,446 | $253,300 | $101,300 | $152,000 |
| 2015 | $5,324 | $253,300 | $101,300 | $152,000 |
| 2014 | $5,342 | $253,300 | $101,300 | $152,000 |
| 2011 | -- | $257,000 | $101,300 | $155,700 |
Source: Public Records
Map
Nearby Homes