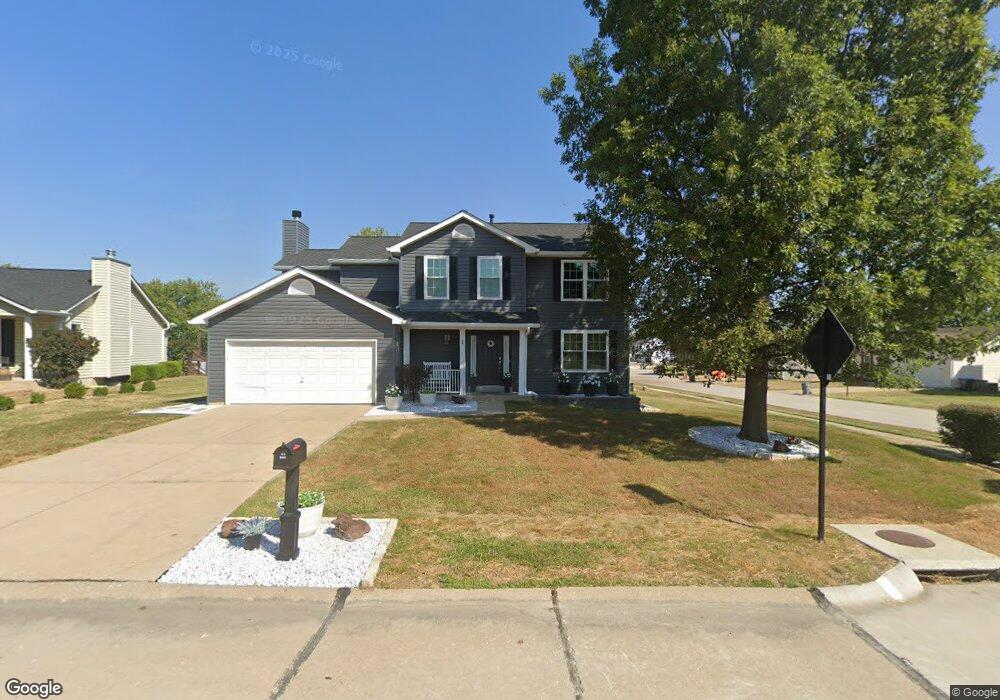
1 Onyx Ct O Fallon, MO 63366
Estimated Value: $375,000 - $399,000
4
Beds
3
Baths
2,162
Sq Ft
$178/Sq Ft
Est. Value
About This Home
This home is located at 1 Onyx Ct, O Fallon, MO 63366 and is currently estimated at $384,602, approximately $177 per square foot. 1 Onyx Ct is a home located in St. Charles County with nearby schools including Forest Park Elementary School, Joseph L. Mudd Elementary School, and Fort Zumwalt North Middle School.
Ownership History
Date
Name
Owned For
Owner Type
Purchase Details
Closed on
Jan 14, 2014
Sold by
Mead Christopher and Mead Mary E
Bought by
Mead Christopher B and Mead Mary E
Current Estimated Value
Home Financials for this Owner
Home Financials are based on the most recent Mortgage that was taken out on this home.
Original Mortgage
$172,975
Outstanding Balance
$127,933
Interest Rate
3.87%
Mortgage Type
FHA
Estimated Equity
$256,669
Purchase Details
Closed on
Mar 30, 2001
Sold by
Premium Homes Inc
Bought by
Mead Christopher and Mead Mary E
Home Financials for this Owner
Home Financials are based on the most recent Mortgage that was taken out on this home.
Original Mortgage
$144,150
Interest Rate
7.13%
Mortgage Type
FHA
Purchase Details
Closed on
Jul 27, 1999
Sold by
Behymer Lawrence F Sr Trustee
Bought by
Trimark Partners
Create a Home Valuation Report for This Property
The Home Valuation Report is an in-depth analysis detailing your home's value as well as a comparison with similar homes in the area
Home Values in the Area
Average Home Value in this Area
Purchase History
| Date | Buyer | Sale Price | Title Company |
|---|---|---|---|
| Mead Christopher B | -- | Tri | |
| Mead Christopher | -- | -- | |
| Premium Homes Inc | -- | -- | |
| Trimark Partners | -- | -- |
Source: Public Records
Mortgage History
| Date | Status | Borrower | Loan Amount |
|---|---|---|---|
| Open | Mead Christopher B | $172,975 | |
| Closed | Mead Christopher | $144,150 |
Source: Public Records
Tax History
| Year | Tax Paid | Tax Assessment Tax Assessment Total Assessment is a certain percentage of the fair market value that is determined by local assessors to be the total taxable value of land and additions on the property. | Land | Improvement |
|---|---|---|---|---|
| 2025 | $3,850 | $64,581 | -- | -- |
| 2023 | $3,851 | $58,188 | $0 | $0 |
| 2022 | $3,210 | $45,046 | $0 | $0 |
| 2021 | $3,212 | $45,046 | $0 | $0 |
| 2020 | $3,128 | $42,510 | $0 | $0 |
| 2019 | $3,135 | $42,510 | $0 | $0 |
| 2018 | $2,912 | $37,676 | $0 | $0 |
| 2017 | $2,873 | $37,676 | $0 | $0 |
| 2016 | $2,847 | $37,196 | $0 | $0 |
| 2015 | $2,647 | $37,196 | $0 | $0 |
| 2014 | $2,402 | $33,186 | $0 | $0 |
Source: Public Records
Map
Nearby Homes
- 805 Saint Joseph Ave
- 508 Saint Christopher Dr
- 0 Tom Ginnever Ave
- 409 Saint Joseph Ave
- 333 Villa Tuscany Ct Unit 5B
- 105 Wabash Spur Dr
- 328 Wabash Manor
- 621 Zumwalt Crossing
- 203 Saint Margaret Ln
- 1715 Diamond Ridge Ct
- 1155 Villa Flora Dr
- 31 Piepers Glen Ct
- 1218 Raintree Pass
- 201 Allen Dr
- 205 E Elm St
- 309 E Pitman St
- 17 Homefield Gardens Dr
- 632 Homerun Dr Unit 33N
- 19 Homefield Gardens Dr Unit 27N
- 218 Centerfield Dr
Your Personal Tour Guide
Ask me questions while you tour the home.