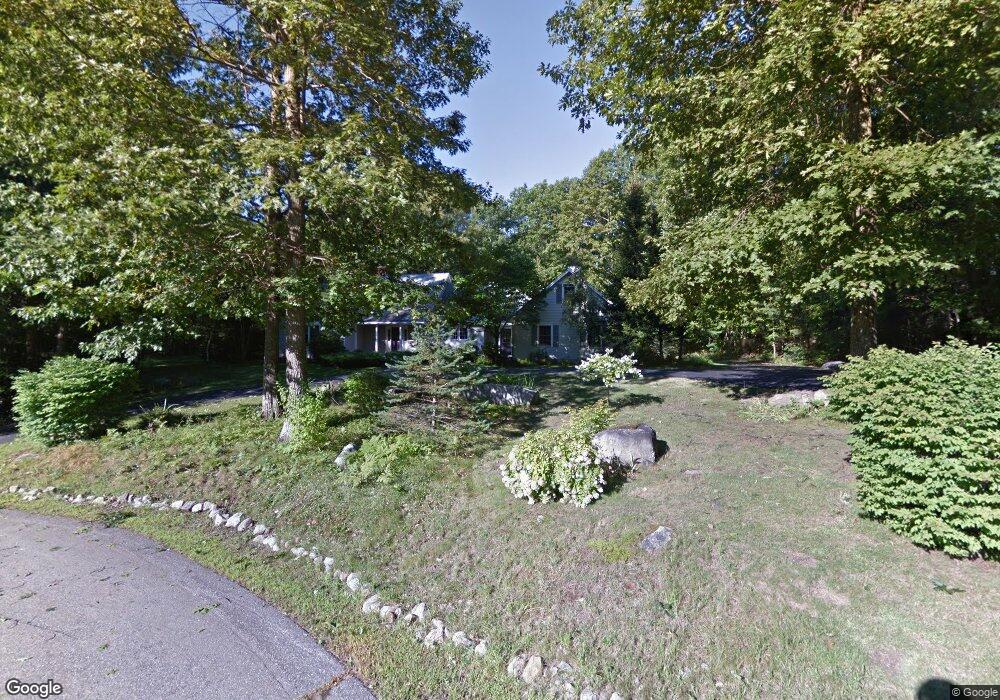
1 Pond Place Ln Concord, NH 03301
North End NeighborhoodEstimated Value: $684,348 - $826,000
3
Beds
2
Baths
2,258
Sq Ft
$331/Sq Ft
Est. Value
About This Home
This home is located at 1 Pond Place Ln, Concord, NH 03301 and is currently estimated at $747,087, approximately $330 per square foot. 1 Pond Place Ln is a home located in Merrimack County with nearby schools including Christa McAuliffe School, Rundlett Middle School, and Concord High School.
Ownership History
Date
Name
Owned For
Owner Type
Purchase Details
Closed on
May 15, 2023
Sold by
Estelle G Koenig 2017 T
Bought by
Powell Tami
Current Estimated Value
Home Financials for this Owner
Home Financials are based on the most recent Mortgage that was taken out on this home.
Original Mortgage
$464,368
Outstanding Balance
$451,290
Interest Rate
6.32%
Mortgage Type
Purchase Money Mortgage
Estimated Equity
$295,797
Purchase Details
Closed on
May 23, 2017
Sold by
Koenig Estelle G
Bought by
Estelle G Koenig 2017
Purchase Details
Closed on
Jan 12, 1996
Sold by
Saturley William C
Bought by
Koenig Charles E and Koenig Estelle G
Create a Home Valuation Report for This Property
The Home Valuation Report is an in-depth analysis detailing your home's value as well as a comparison with similar homes in the area
Home Values in the Area
Average Home Value in this Area
Purchase History
| Date | Buyer | Sale Price | Title Company |
|---|---|---|---|
| Powell Tami | $590,000 | None Available | |
| Estelle G Koenig 2017 | -- | -- | |
| Koenig Charles E | $28,100 | -- |
Source: Public Records
Mortgage History
| Date | Status | Borrower | Loan Amount |
|---|---|---|---|
| Open | Powell Tami | $464,368 |
Source: Public Records
Tax History Compared to Growth
Tax History
| Year | Tax Paid | Tax Assessment Tax Assessment Total Assessment is a certain percentage of the fair market value that is determined by local assessors to be the total taxable value of land and additions on the property. | Land | Improvement |
|---|---|---|---|---|
| 2024 | $12,247 | $442,300 | $140,900 | $301,400 |
| 2023 | $11,732 | $436,800 | $140,900 | $295,900 |
| 2022 | $11,309 | $436,800 | $140,900 | $295,900 |
| 2021 | $10,972 | $436,800 | $140,900 | $295,900 |
| 2020 | $10,426 | $389,600 | $117,300 | $272,300 |
| 2019 | $10,856 | $390,800 | $125,200 | $265,600 |
| 2018 | $10,673 | $378,600 | $125,600 | $253,000 |
| 2017 | $10,279 | $364,000 | $125,600 | $238,400 |
| 2016 | $9,781 | $353,500 | $125,600 | $227,900 |
| 2015 | $9,353 | $340,900 | $109,300 | $231,600 |
| 2014 | $8,990 | $340,900 | $109,300 | $231,600 |
| 2013 | -- | $332,600 | $109,300 | $223,300 |
| 2012 | -- | $329,700 | $114,500 | $215,200 |
Source: Public Records
Map
Nearby Homes
- 157 Rumford St
- 1 Kensington Rd
- 2 Kensington Rd
- 17 Essex St
- 30 Jackson St
- 8-10 Granite Ave
- 20 Prospect St
- 54 Pleasant St Unit 8
- 282-284 N State St
- 3 Palm St
- 47 South St
- 4 Fayette St
- 24 Pierce St
- 12 Avon St
- 14-16 Perley St
- 14 Downing St
- 10 Perley St
- 122 South St
- 87 S Main St Unit 2
- 0 Spruce St Unit 88