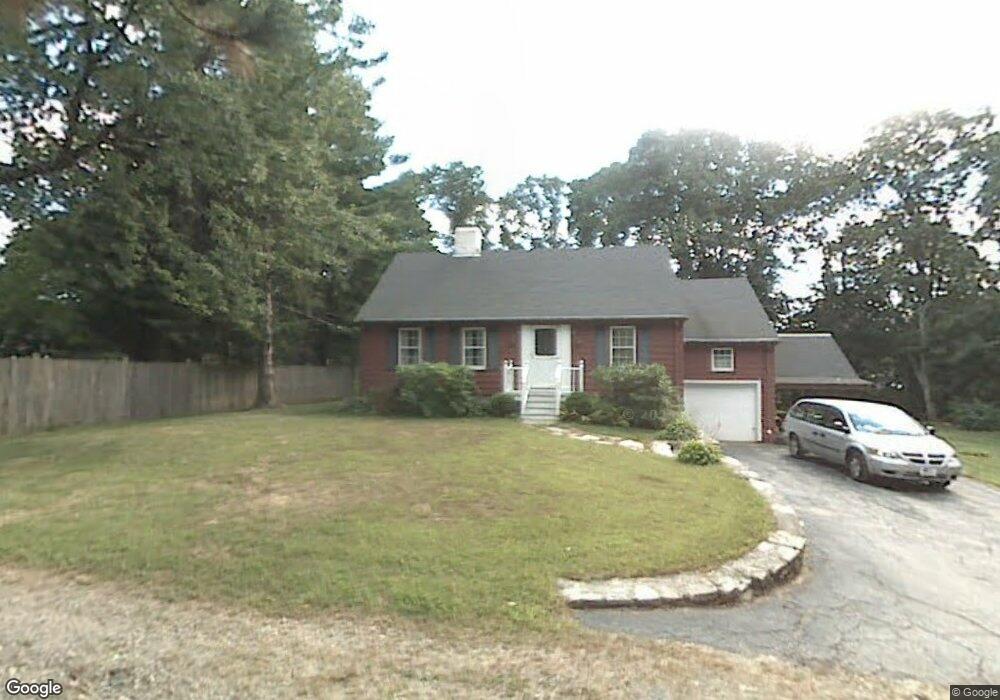
1 Pratt Rd Worcester, MA 01606
Indian Hill NeighborhoodEstimated Value: $379,175 - $408,000
2
Beds
2
Baths
1,113
Sq Ft
$357/Sq Ft
Est. Value
About This Home
This home is located at 1 Pratt Rd, Worcester, MA 01606 and is currently estimated at $397,044, approximately $356 per square foot. 1 Pratt Rd is a home located in Worcester County with nearby schools including Nelson Place Elementary School, Jacob Hiatt Magnet School, and Chandler Magnet.
Ownership History
Date
Name
Owned For
Owner Type
Purchase Details
Closed on
Feb 1, 2013
Sold by
Defeudis Susan D
Bought by
Tyson Jeremy and Tyson Lynne
Current Estimated Value
Home Financials for this Owner
Home Financials are based on the most recent Mortgage that was taken out on this home.
Original Mortgage
$147,200
Outstanding Balance
$102,901
Interest Rate
3.41%
Mortgage Type
New Conventional
Estimated Equity
$294,143
Purchase Details
Closed on
Jul 26, 2011
Sold by
Est Hjelm Harvey C and Hjelm Jon A
Bought by
Defeudis Susan D
Create a Home Valuation Report for This Property
The Home Valuation Report is an in-depth analysis detailing your home's value as well as a comparison with similar homes in the area
Home Values in the Area
Average Home Value in this Area
Purchase History
| Date | Buyer | Sale Price | Title Company |
|---|---|---|---|
| Tyson Jeremy | $155,000 | -- | |
| Tyson Jeremy | $155,000 | -- | |
| Defeudis Susan D | -- | -- |
Source: Public Records
Mortgage History
| Date | Status | Borrower | Loan Amount |
|---|---|---|---|
| Open | Tyson Jeremy | $147,200 | |
| Closed | Tyson Jeremy | $147,200 |
Source: Public Records
Tax History
| Year | Tax Paid | Tax Assessment Tax Assessment Total Assessment is a certain percentage of the fair market value that is determined by local assessors to be the total taxable value of land and additions on the property. | Land | Improvement |
|---|---|---|---|---|
| 2025 | $4,358 | $330,400 | $119,500 | $210,900 |
| 2024 | $4,291 | $312,100 | $119,500 | $192,600 |
| 2023 | $4,098 | $285,800 | $103,900 | $181,900 |
| 2022 | $3,736 | $245,600 | $83,100 | $162,500 |
| 2021 | $3,528 | $216,700 | $66,500 | $150,200 |
| 2020 | $3,451 | $203,000 | $66,400 | $136,600 |
| 2019 | $3,290 | $182,800 | $60,100 | $122,700 |
| 2018 | $3,311 | $175,100 | $60,100 | $115,000 |
| 2017 | $3,183 | $165,600 | $60,100 | $105,500 |
| 2016 | $3,116 | $151,200 | $45,600 | $105,600 |
| 2015 | $3,035 | $151,200 | $45,600 | $105,600 |
| 2014 | $2,954 | $151,200 | $45,600 | $105,600 |
Source: Public Records
Map
Nearby Homes
- 120 Brattle St
- 270 Brattle St
- 42 N Worcester Ave
- 41 Mohave Rd
- 37 Mohave Rd
- 39 Mountainshire Dr
- 250 Shrewsbury St
- 90 Bjorklund Ave
- 30 Danielles Way
- 158 Chester St
- 82 Holden St
- 23 Gail Dr
- 97 Parkton Ave
- 12 Tattan Farm Rd
- 53 Collins St
- 30 Osgood Ave
- 22 Danielles Way
- 26 Danielles Way
- 31 Danielles Way
- 25 Chester St
Your Personal Tour Guide
Ask me questions while you tour the home.