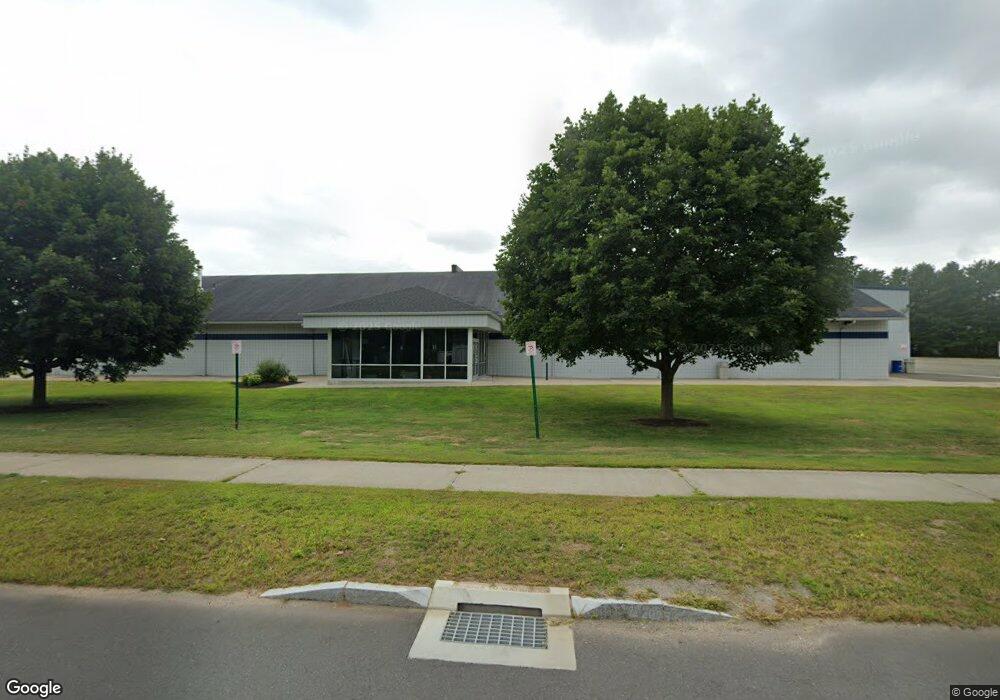
1 Prior Rd Enfield, CT 06082
Estimated Value: $4,720,782
--
Bed
--
Bath
52,956
Sq Ft
$89/Sq Ft
Est. Value
About This Home
This home is located at 1 Prior Rd, Enfield, CT 06082 and is currently estimated at $4,720,782, approximately $89 per square foot. 1 Prior Rd is a home located in Hartford County with nearby schools including Eli Whitney Elementary School, Hazardville Memorial Elementary School, and John F. Kennedy Middle School.
Ownership History
Date
Name
Owned For
Owner Type
Purchase Details
Closed on
Feb 9, 2022
Sold by
Hillebrecht Group Llc
Bought by
Etr Operating Llc
Current Estimated Value
Purchase Details
Closed on
Aug 26, 2008
Sold by
Etr Enterprises Llc
Bought by
Hillebredit Group Llc
Purchase Details
Closed on
Oct 3, 1997
Sold by
Reel Ice Inc
Bought by
Etr Enterprises Llc
Create a Home Valuation Report for This Property
The Home Valuation Report is an in-depth analysis detailing your home's value as well as a comparison with similar homes in the area
Home Values in the Area
Average Home Value in this Area
Purchase History
| Date | Buyer | Sale Price | Title Company |
|---|---|---|---|
| Etr Operating Llc | $3,500,000 | None Available | |
| Hillebredit Group Llc | $3,750,000 | -- | |
| Etr Enterprises Llc | $2,050,000 | -- |
Source: Public Records
Mortgage History
| Date | Status | Borrower | Loan Amount |
|---|---|---|---|
| Previous Owner | Etr Enterprises Llc | $3,050,000 | |
| Previous Owner | Etr Enterprises Llc | $1,304,000 | |
| Previous Owner | Etr Enterprises Llc | $145,000 |
Source: Public Records
Tax History Compared to Growth
Tax History
| Year | Tax Paid | Tax Assessment Tax Assessment Total Assessment is a certain percentage of the fair market value that is determined by local assessors to be the total taxable value of land and additions on the property. | Land | Improvement |
|---|---|---|---|---|
| 2025 | $72,468 | $2,071,100 | $276,900 | $1,794,200 |
| 2024 | $70,521 | $2,071,100 | $276,900 | $1,794,200 |
| 2023 | $70,003 | $2,071,100 | $276,900 | $1,794,200 |
| 2022 | $63,562 | $2,071,100 | $276,900 | $1,794,200 |
| 2021 | $78,709 | $2,097,230 | $232,960 | $1,864,270 |
| 2020 | $86,580 | $2,306,950 | $442,680 | $1,864,270 |
| 2019 | $78,919 | $2,097,230 | $232,960 | $1,864,270 |
| 2018 | $77,598 | $2,097,230 | $232,960 | $1,864,270 |
| 2017 | $73,176 | $2,094,930 | $232,960 | $1,861,970 |
| 2016 | $80,638 | $2,350,290 | $232,960 | $2,117,330 |
| 2015 | $78,124 | $2,350,290 | $232,960 | $2,117,330 |
| 2014 | $76,102 | $2,350,290 | $232,960 | $2,117,330 |
Source: Public Records
Map
Nearby Homes