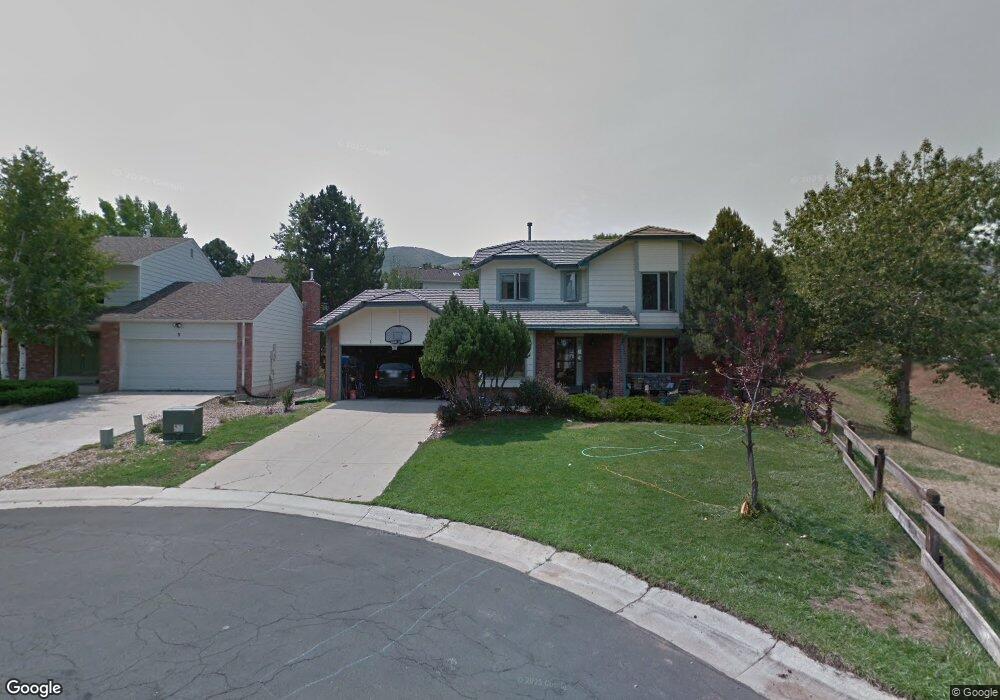
1 Red Locust Littleton, CO 80127
Estimated Value: $931,267 - $1,084,000
4
Beds
7
Baths
2,454
Sq Ft
$409/Sq Ft
Est. Value
About This Home
This home is located at 1 Red Locust, Littleton, CO 80127 and is currently estimated at $1,003,567, approximately $408 per square foot. 1 Red Locust is a home located in Jefferson County with nearby schools including Bradford K8 South, Bradford K8 North, and Chatfield High School.
Ownership History
Date
Name
Owned For
Owner Type
Purchase Details
Closed on
Feb 4, 2005
Sold by
Fitzgerald David C and Fitzgerald Tracy L
Bought by
Bailey James S and Bailey Traci J
Current Estimated Value
Home Financials for this Owner
Home Financials are based on the most recent Mortgage that was taken out on this home.
Original Mortgage
$321,600
Interest Rate
5.85%
Mortgage Type
New Conventional
Create a Home Valuation Report for This Property
The Home Valuation Report is an in-depth analysis detailing your home's value as well as a comparison with similar homes in the area
Home Values in the Area
Average Home Value in this Area
Purchase History
| Date | Buyer | Sale Price | Title Company |
|---|---|---|---|
| Bailey James S | $402,000 | Security Title |
Source: Public Records
Mortgage History
| Date | Status | Borrower | Loan Amount |
|---|---|---|---|
| Open | Bailey James S | $300,000 | |
| Closed | Bailey James S | $369,898 | |
| Closed | Bailey James S | $321,600 | |
| Previous Owner | Fitzgerald David C | $15,000 | |
| Closed | Bailey James S | $80,400 |
Source: Public Records
Tax History Compared to Growth
Tax History
| Year | Tax Paid | Tax Assessment Tax Assessment Total Assessment is a certain percentage of the fair market value that is determined by local assessors to be the total taxable value of land and additions on the property. | Land | Improvement |
|---|---|---|---|---|
| 2024 | $5,235 | $50,464 | $14,261 | $36,203 |
| 2023 | $5,403 | $50,464 | $14,261 | $36,203 |
| 2022 | $4,679 | $42,746 | $13,310 | $29,436 |
| 2021 | $4,751 | $43,976 | $13,693 | $30,283 |
| 2020 | $4,322 | $40,136 | $12,318 | $27,818 |
| 2019 | $4,271 | $40,136 | $12,318 | $27,818 |
| 2018 | $3,965 | $35,990 | $9,875 | $26,115 |
| 2017 | $3,688 | $35,990 | $9,875 | $26,115 |
| 2016 | $3,886 | $35,887 | $11,163 | $24,724 |
| 2015 | $3,496 | $35,887 | $11,163 | $24,724 |
| 2014 | $3,496 | $30,427 | $8,545 | $21,882 |
Source: Public Records
Map
Nearby Homes
- 16 Honey Locust
- 1 Cliffrose
- 25 Summit Ash
- 10 Oakmont Ln
- 39 Buckthorn Dr
- 8 Oakmont Ln
- 5 Tamarade Dr
- 4 Oakmont Ln
- 1 Amaranth Dr
- 85 Willowleaf Dr
- 87 Deerwood Dr
- 12 Long Spur
- 2 Silvermound
- 18 Blue Sage
- 6 Amberwood Ln
- 7367 S Yank Ct
- 7346 S Yank Ct
- 7316 S Yank Ct
- 12750 W Glasgow Place
- 12740 W Glasgow Place