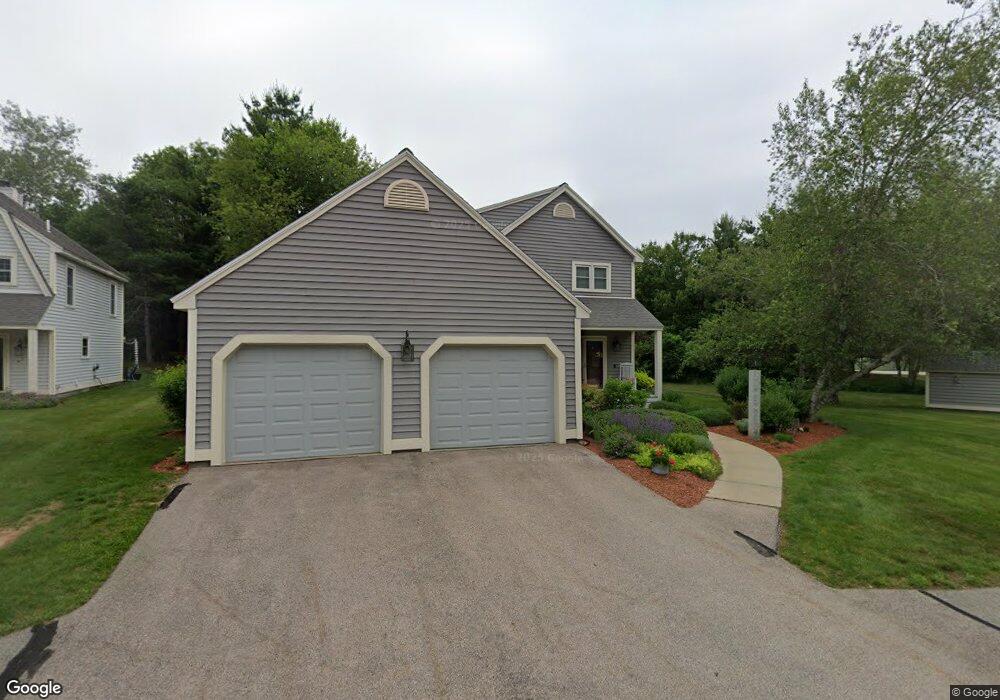
1 Roberta Dr Merrimack, NH 03054
Estimated Value: $511,930 - $610,000
3
Beds
3
Baths
2,060
Sq Ft
$266/Sq Ft
Est. Value
About This Home
This home is located at 1 Roberta Dr, Merrimack, NH 03054 and is currently estimated at $548,233, approximately $266 per square foot. 1 Roberta Dr is a home located in Hillsborough County with nearby schools including Reeds Ferry School, James Mastricola Upper Elementary School, and Merrimack Middle School.
Ownership History
Date
Name
Owned For
Owner Type
Purchase Details
Closed on
Sep 9, 2015
Sold by
Sullivan Daniel R
Bought by
Sullivan Joann S
Current Estimated Value
Home Financials for this Owner
Home Financials are based on the most recent Mortgage that was taken out on this home.
Original Mortgage
$196,000
Outstanding Balance
$154,469
Interest Rate
4.01%
Mortgage Type
Purchase Money Mortgage
Estimated Equity
$393,764
Purchase Details
Closed on
Jun 30, 2010
Sold by
Wendelken Derek and Wendelken Linda
Bought by
Sullivan Daniel R and Sullivan Jo-Ann S
Home Financials for this Owner
Home Financials are based on the most recent Mortgage that was taken out on this home.
Original Mortgage
$207,920
Interest Rate
4.88%
Mortgage Type
Purchase Money Mortgage
Purchase Details
Closed on
Mar 4, 2003
Sold by
Cosgrove David W and Cosgrove Johanne
Bought by
Wendelken Derek and Wendelken Linda
Home Financials for this Owner
Home Financials are based on the most recent Mortgage that was taken out on this home.
Original Mortgage
$134,000
Interest Rate
5.98%
Create a Home Valuation Report for This Property
The Home Valuation Report is an in-depth analysis detailing your home's value as well as a comparison with similar homes in the area
Home Values in the Area
Average Home Value in this Area
Purchase History
| Date | Buyer | Sale Price | Title Company |
|---|---|---|---|
| Sullivan Joann S | -- | -- | |
| Sullivan Daniel R | $259,900 | -- | |
| Wendelken Derek | $234,000 | -- |
Source: Public Records
Mortgage History
| Date | Status | Borrower | Loan Amount |
|---|---|---|---|
| Open | Sullivan Joann S | $196,000 | |
| Previous Owner | Wendelken Derek | $201,100 | |
| Previous Owner | Wendelken Derek | $207,920 | |
| Previous Owner | Wendelken Derek | $134,000 |
Source: Public Records
Tax History Compared to Growth
Tax History
| Year | Tax Paid | Tax Assessment Tax Assessment Total Assessment is a certain percentage of the fair market value that is determined by local assessors to be the total taxable value of land and additions on the property. | Land | Improvement |
|---|---|---|---|---|
| 2024 | $7,678 | $371,100 | $0 | $371,100 |
| 2023 | $7,218 | $371,100 | $0 | $371,100 |
| 2022 | $6,450 | $371,100 | $0 | $371,100 |
| 2021 | $6,372 | $371,100 | $0 | $371,100 |
| 2020 | $6,118 | $254,300 | $0 | $254,300 |
| 2019 | $6,136 | $254,300 | $0 | $254,300 |
| 2018 | $6,134 | $254,300 | $0 | $254,300 |
| 2017 | $5,943 | $254,300 | $0 | $254,300 |
| 2016 | $5,795 | $254,300 | $0 | $254,300 |
| 2015 | $5,661 | $229,000 | $0 | $229,000 |
| 2014 | $5,517 | $229,000 | $0 | $229,000 |
| 2013 | $5,954 | $249,000 | $0 | $249,000 |
Source: Public Records
Map
Nearby Homes
- 115 Back River Rd
- 6 Boulder Way
- 5 Crosswoods Path Blvd Unit B4
- 14 Bernards Rd
- 12 Bernards Rd
- 2 Galloway Rd Unit 38
- 33 Belmont Dr
- 9 Mustang Dr Unit END UNIT-D
- 9 Mustang Dr Unit C
- 9 Mustang Dr Unit B
- 7 Mustang Dr Unit B
- 7 Mustang Dr Unit END UNIT-A
- 7 Mustang Dr Unit C
- 3 Mustang Dr Unit B
- 29 Bedford Rd
- 3-C Mustang Dr Unit MODEL
- 4243 Brown Ave
- 395 Brent St
- 21 Adams Green
- 707 Brent St