1 Sabrina Ct Methuen, MA 01844
The West End NeighborhoodEstimated Value: $761,411 - $851,000
3
Beds
3
Baths
2,360
Sq Ft
$343/Sq Ft
Est. Value
About This Home
This home is located at 1 Sabrina Ct, Methuen, MA 01844 and is currently estimated at $808,603, approximately $342 per square foot. 1 Sabrina Ct is a home located in Essex County with nearby schools including Marsh Grammar School, Methuen High School, and The Islamic Academy For Peace.
Ownership History
Date
Name
Owned For
Owner Type
Purchase Details
Closed on
May 16, 2005
Sold by
Kim Sang-Ho
Bought by
Basaga Mehmet and Basaga Hatice
Current Estimated Value
Home Financials for this Owner
Home Financials are based on the most recent Mortgage that was taken out on this home.
Original Mortgage
$175,000
Outstanding Balance
$91,294
Interest Rate
6.05%
Mortgage Type
Purchase Money Mortgage
Estimated Equity
$717,309
Purchase Details
Closed on
Mar 1, 2002
Sold by
Century Bldrs Inc
Bought by
Kim Sang Ho
Home Financials for this Owner
Home Financials are based on the most recent Mortgage that was taken out on this home.
Original Mortgage
$324,000
Interest Rate
6.85%
Mortgage Type
Purchase Money Mortgage
Create a Home Valuation Report for This Property
The Home Valuation Report is an in-depth analysis detailing your home's value as well as a comparison with similar homes in the area
Home Values in the Area
Average Home Value in this Area
Purchase History
| Date | Buyer | Sale Price | Title Company |
|---|---|---|---|
| Basaga Mehmet | $475,000 | -- | |
| Basaga Mehmet | $475,000 | -- | |
| Kim Sang Ho | $360,000 | -- | |
| Kim Sang Ho | $360,000 | -- |
Source: Public Records
Mortgage History
| Date | Status | Borrower | Loan Amount |
|---|---|---|---|
| Open | Basaga Mehmet | $175,000 | |
| Closed | Kim Sang Ho | $175,000 | |
| Previous Owner | Kim Sang Ho | $324,000 |
Source: Public Records
Tax History
| Year | Tax Paid | Tax Assessment Tax Assessment Total Assessment is a certain percentage of the fair market value that is determined by local assessors to be the total taxable value of land and additions on the property. | Land | Improvement |
|---|---|---|---|---|
| 2025 | $7,472 | $706,200 | $257,200 | $449,000 |
| 2024 | $7,477 | $688,500 | $234,600 | $453,900 |
| 2023 | $7,158 | $611,800 | $208,500 | $403,300 |
| 2022 | $7,025 | $538,300 | $173,800 | $364,500 |
| 2021 | $6,607 | $500,900 | $165,100 | $335,800 |
| 2020 | $6,540 | $486,600 | $165,100 | $321,500 |
| 2019 | $6,327 | $445,900 | $147,700 | $298,200 |
| 2018 | $6,152 | $431,100 | $147,700 | $283,400 |
| 2017 | $5,952 | $406,300 | $147,700 | $258,600 |
| 2016 | $5,816 | $392,700 | $139,000 | $253,700 |
| 2015 | $5,589 | $382,800 | $139,000 | $243,800 |
Source: Public Records
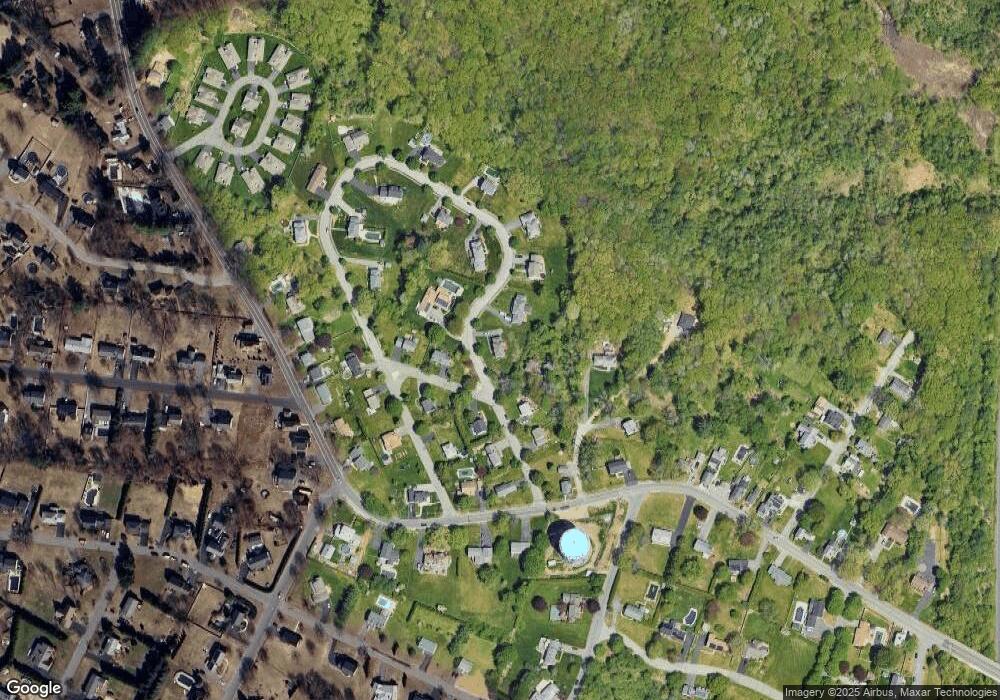
Map
Nearby Homes
- 2 Landmark Dr
- 65 Clayton Ave
- 534 Forest St
- 3 Oxyoke Dr
- 37 Maplewood Ave
- 42 Perley St
- 37 Lexington Ave
- 252 Pelham St
- 20 Ruskin Ave
- 296 Pelham St
- 76 Haverhill St
- 65 Pinehurst Ave
- 7-9 Carleton Ct
- 14-16 Cypress Ave
- 20-22 Ashland Ave
- 88-90 Columbus Ave
- 13 Caswell Ave
- 42-44 Cypress Ave
- 58 Campus Rd
- 2 Grove St
Your Personal Tour Guide
Ask me questions while you tour the home.