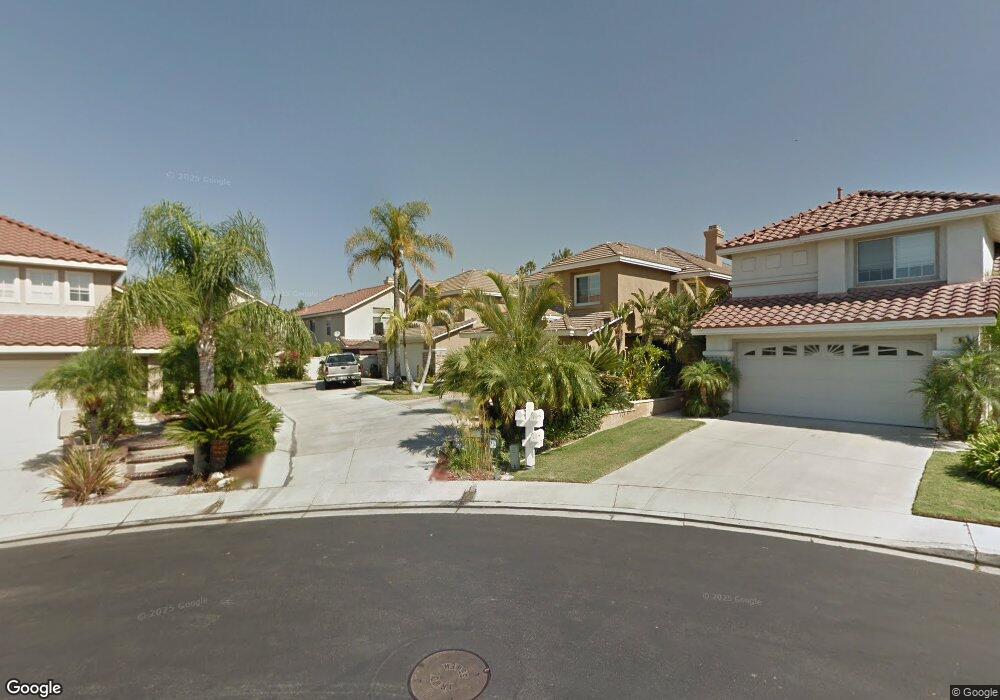
1 Sagecrest Foothill Ranch, CA 92610
Estimated Value: $1,225,000 - $1,356,000
3
Beds
3
Baths
2,178
Sq Ft
$593/Sq Ft
Est. Value
About This Home
This home is located at 1 Sagecrest, Foothill Ranch, CA 92610 and is currently estimated at $1,290,845, approximately $592 per square foot. 1 Sagecrest is a home located in Orange County with nearby schools including Foothill Ranch Elementary School, Rancho Santa Margarita Intermediate School, and Trabuco Hills High School.
Ownership History
Date
Name
Owned For
Owner Type
Purchase Details
Closed on
May 11, 2019
Sold by
Sik Chong and Rlt Pak Rlt
Bought by
Sik Chong and Rlt Pak Rlt
Current Estimated Value
Home Financials for this Owner
Home Financials are based on the most recent Mortgage that was taken out on this home.
Original Mortgage
$365,000
Outstanding Balance
$319,599
Interest Rate
4%
Mortgage Type
New Conventional
Estimated Equity
$971,246
Purchase Details
Closed on
Jun 29, 2013
Sold by
Pak Chong Sik and Pak Rebecca A
Bought by
Chong Sik & Rebecca Pak Revocable Living
Purchase Details
Closed on
Feb 27, 2004
Sold by
Hayes Paul Chandler and Hayes Joqueta C
Bought by
Pak Chong Sik and Pak Rebecca A
Home Financials for this Owner
Home Financials are based on the most recent Mortgage that was taken out on this home.
Original Mortgage
$290,000
Interest Rate
5.39%
Mortgage Type
Purchase Money Mortgage
Purchase Details
Closed on
Feb 25, 1998
Sold by
Fish Joseph M and Fish Kari Lynne
Bought by
Hayes Paul Chandler and Hayes Joqueta C
Home Financials for this Owner
Home Financials are based on the most recent Mortgage that was taken out on this home.
Original Mortgage
$217,550
Interest Rate
7.18%
Mortgage Type
New Conventional
Purchase Details
Closed on
Mar 13, 1997
Sold by
Terri J Fish Joseph
Bought by
Fish Joseph M and Fish Kari Lynne
Home Financials for this Owner
Home Financials are based on the most recent Mortgage that was taken out on this home.
Original Mortgage
$175,000
Interest Rate
7.74%
Purchase Details
Closed on
Oct 20, 1994
Sold by
Kaufman & Broad South Coast Inc
Bought by
Fish Joseph M and Fish Kari Lynne
Home Financials for this Owner
Home Financials are based on the most recent Mortgage that was taken out on this home.
Original Mortgage
$175,400
Interest Rate
6.25%
Create a Home Valuation Report for This Property
The Home Valuation Report is an in-depth analysis detailing your home's value as well as a comparison with similar homes in the area
Home Values in the Area
Average Home Value in this Area
Purchase History
| Date | Buyer | Sale Price | Title Company |
|---|---|---|---|
| Sik Chong | -- | Wfg Lender Services | |
| Chong Sik & Rebecca Pak Revocable Living | -- | None Available | |
| Pak Chong Sik | $595,000 | First American Title Company | |
| Hayes Paul Chandler | $230,000 | Commonwealth Land Title | |
| Fish Joseph M | -- | -- | |
| Fish Joseph M | $195,000 | First American Title Ins |
Source: Public Records
Mortgage History
| Date | Status | Borrower | Loan Amount |
|---|---|---|---|
| Open | Sik Chong | $365,000 | |
| Previous Owner | Pak Chong Sik | $290,000 | |
| Previous Owner | Hayes Paul Chandler | $217,550 | |
| Previous Owner | Fish Joseph M | $175,000 | |
| Previous Owner | Fish Joseph M | $175,400 |
Source: Public Records
Tax History
| Year | Tax Paid | Tax Assessment Tax Assessment Total Assessment is a certain percentage of the fair market value that is determined by local assessors to be the total taxable value of land and additions on the property. | Land | Improvement |
|---|---|---|---|---|
| 2025 | $8,637 | $845,959 | $586,743 | $259,216 |
| 2024 | $8,637 | $829,372 | $575,238 | $254,134 |
| 2023 | $8,432 | $813,110 | $563,959 | $249,151 |
| 2022 | $8,280 | $797,167 | $552,901 | $244,266 |
| 2021 | $7,495 | $781,537 | $542,060 | $239,477 |
| 2020 | $8,041 | $773,524 | $536,502 | $237,022 |
| 2019 | $7,879 | $758,357 | $525,982 | $232,375 |
| 2018 | $7,731 | $743,488 | $515,669 | $227,819 |
| 2017 | $7,381 | $710,000 | $505,558 | $204,442 |
| 2016 | $7,627 | $664,000 | $470,518 | $193,482 |
| 2015 | $7,350 | $632,000 | $438,518 | $193,482 |
| 2014 | $7,621 | $598,118 | $404,636 | $193,482 |
Source: Public Records
Map
Nearby Homes
Your Personal Tour Guide
Ask me questions while you tour the home.